There was a sharp fall in crypto prices in broad markets on April 19-20. This makes us wonder if we are truly out of crypto winter or if something is still left.
We have used on-chain data and technical analysis to determine if the current sharp fall in prices results from routine profit booking or has panic selling returned to crypto markets.
The Current Market Situation

The overall crypto markets witnessed a sharp fall in prices in the last couple of days. The fall started around 8 am UTC on April 19, 2023. All major cryptocurrencies witnessed sharp selling, including Bitcoin, Ethereum, XRP, and others.
In the last 24 hours alone, Bitcoin lost 2.11% and fell below $30k, while Ethereum lost 1.6% to fall shy of $1,950. XRP, which is battling the SEC in the courts, has also lost 1.35% in the last 24 hours to fall below $0.5.
The overall crypto markets slid down from $1.28 trillion to $1.20 trillion.
Let us explore on-chain data to identify if this is panic selling or just profit booking.
On-Chain Data Shows Record Crypto Adoption
On-Chain Data shows that there has been selling from large investors who hold more than 10 ETH. Also, the total addresses with more than 10 ETH are at a 4-month low after continually dropping since Dec-2022.
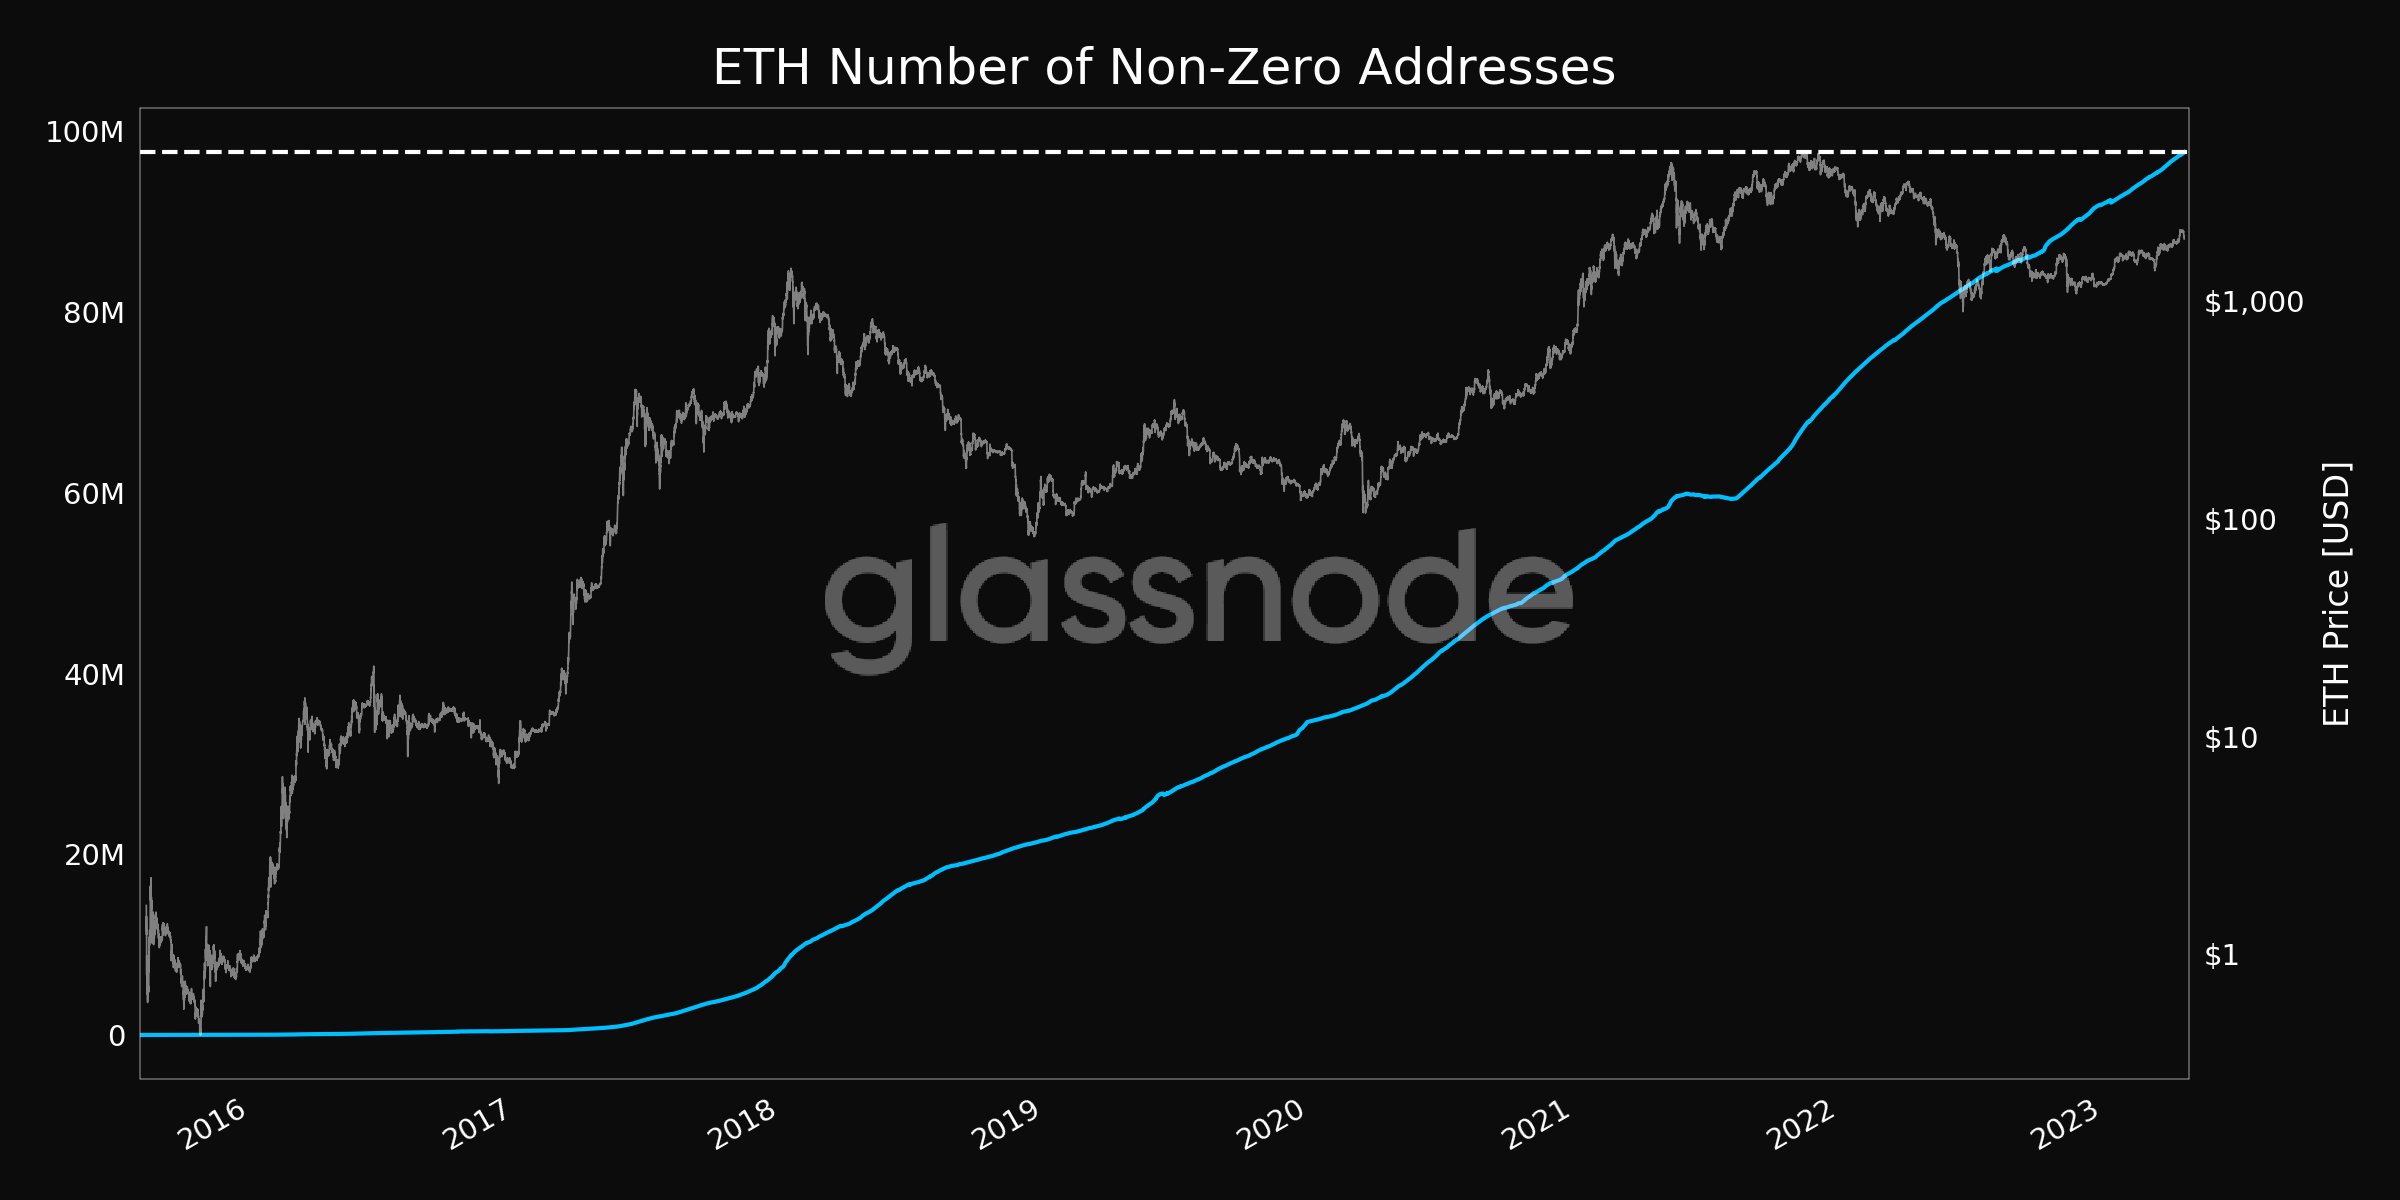
However, there has been a boom in non-zero addresses. Addresses that contain Ethereum are at a record high of 97.6 million. This also shows that there is an increase in the mass adoption of Ethereum.
If you look closely at the graph, you can see that there has never been a drop in ETH addresses except for a brief phase in late 2021 and early 2022.
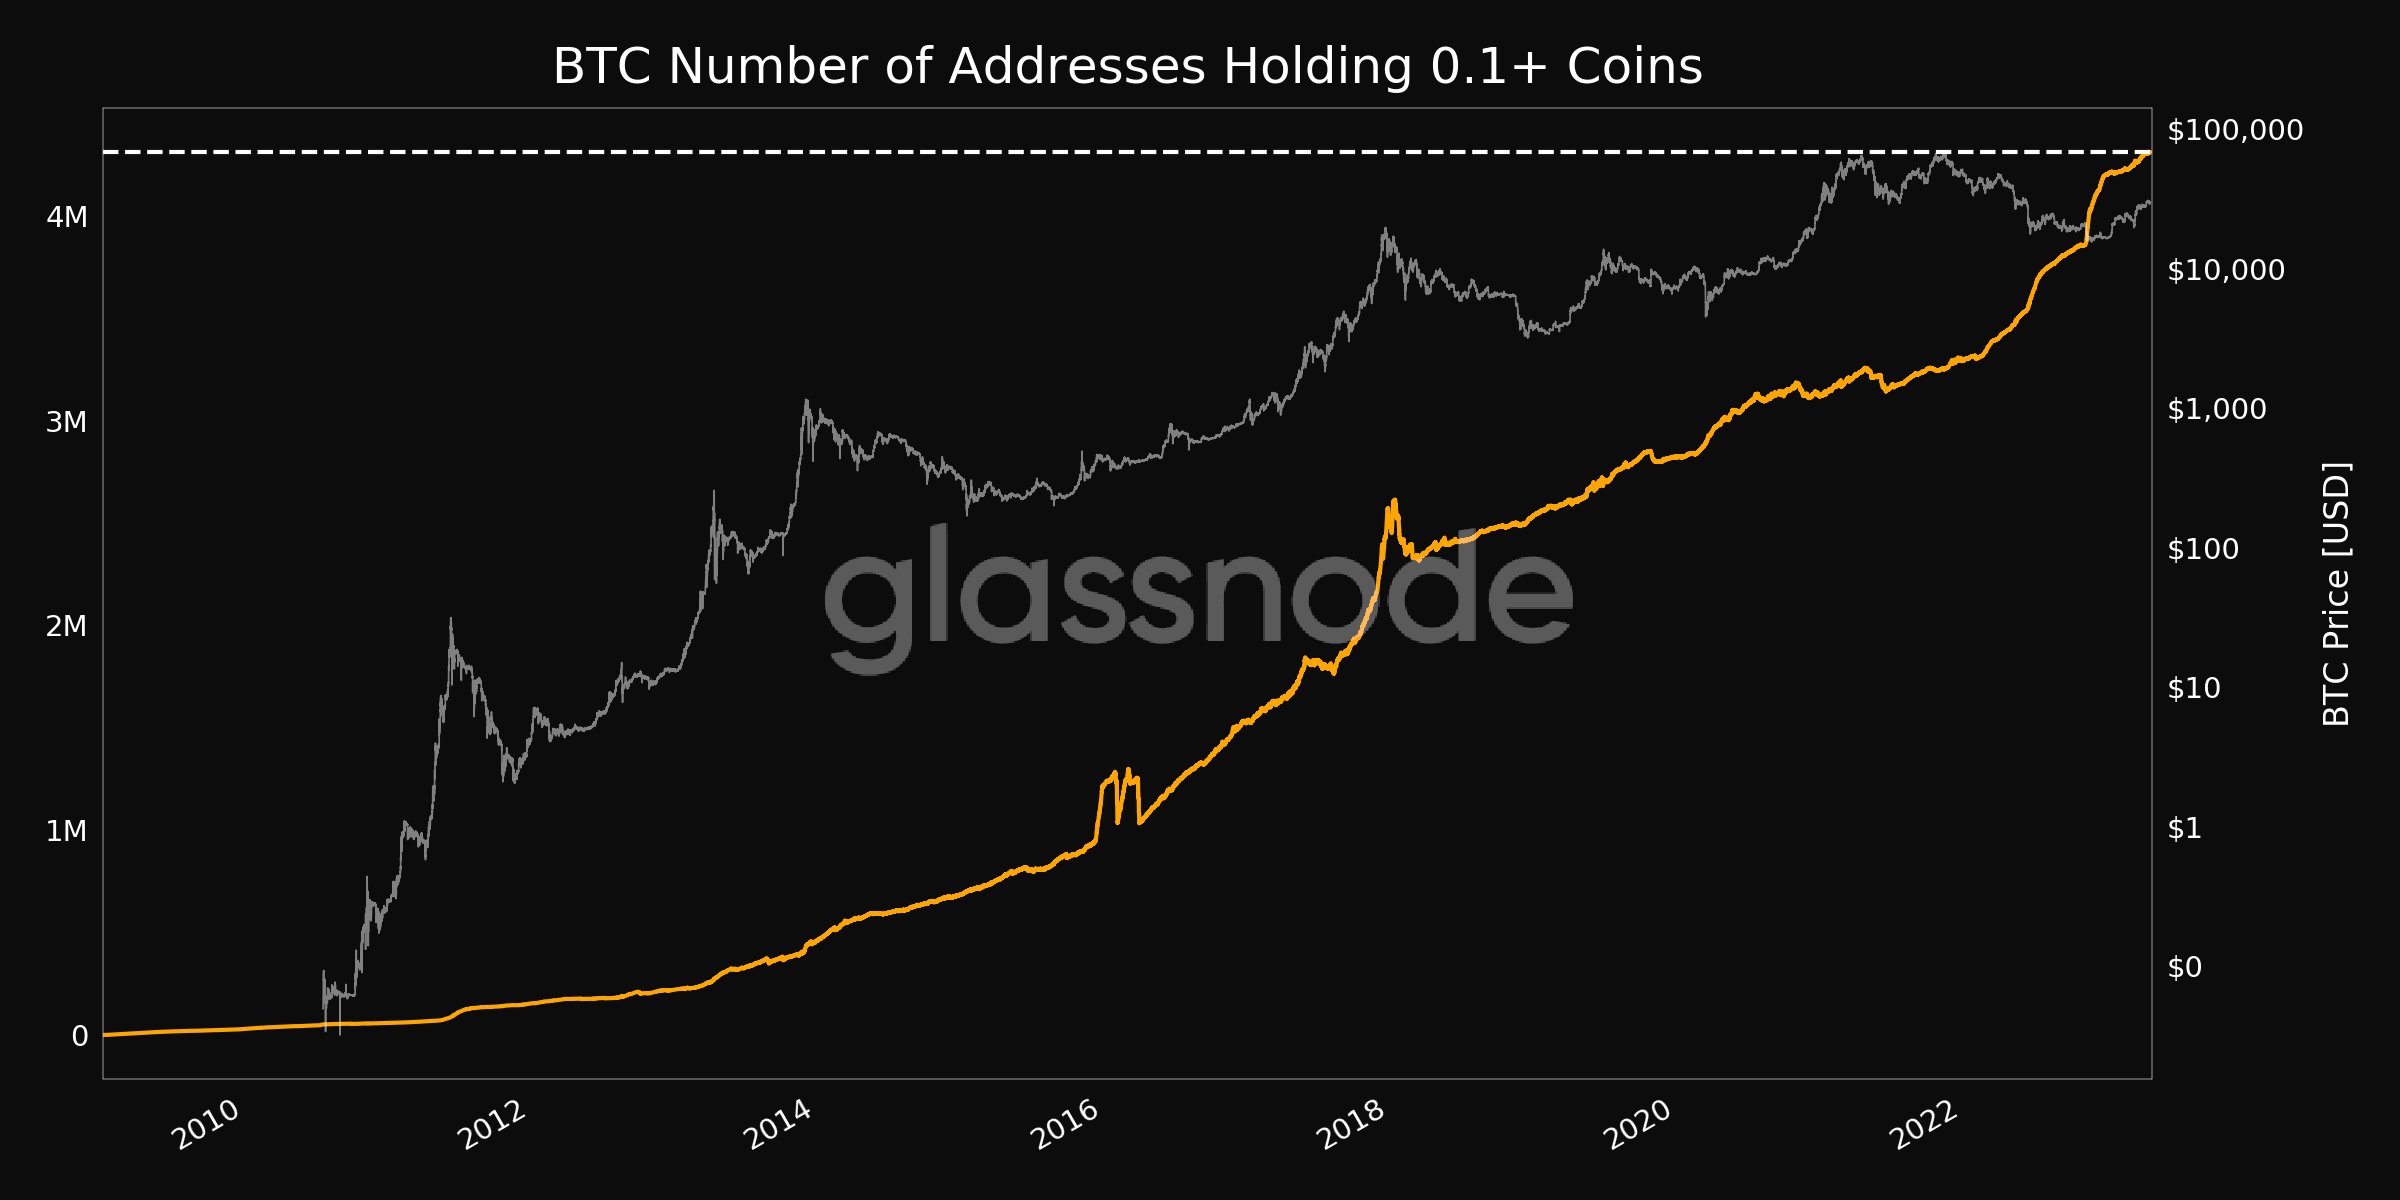
Similarly, the number of addresses holding more than 0.1 BTC also reached an all-time high of 4.3 million addresses for Bitcoin. This shows that Bitcoin is also achieving wider adoption.
Together with Ethereum, Bitcoin dominates 65% of crypto markets.
Profit Booking Caused Fall in Crypto Prices
Since on-chain activity shows that the current fall in prices has driven higher crypto adoption, we can be sure that this fall is just regular profit booking.
Another proof of profit booking comes from the fact that a couple of days before the price fall in cryptocurrencies, more than 65% of addresses were in profit. Some of these addresses have been at a loss since the crypto winter and wanted to get out desperately.
Is this a Buying or Shorting Opportunity?
The current situation definitely looks like a buying opportunity for Bitcoin. This is because on-chain data shows an ever-increasing user base since Bitcoin’s launch in 2009.
A wider adoption, coupled with a limited amount of Bitcoin (21 million BTC), would surely create high demand and push the price further. The same has been true for Etheruem since its launch in 2014. ETH is unlimited in supply, but its release is well controlled.
Let us look at technical charts for both Bitcoin and Ethereum to see if there is a buying to shorting opportunity.
Bitcoin Price Analysis
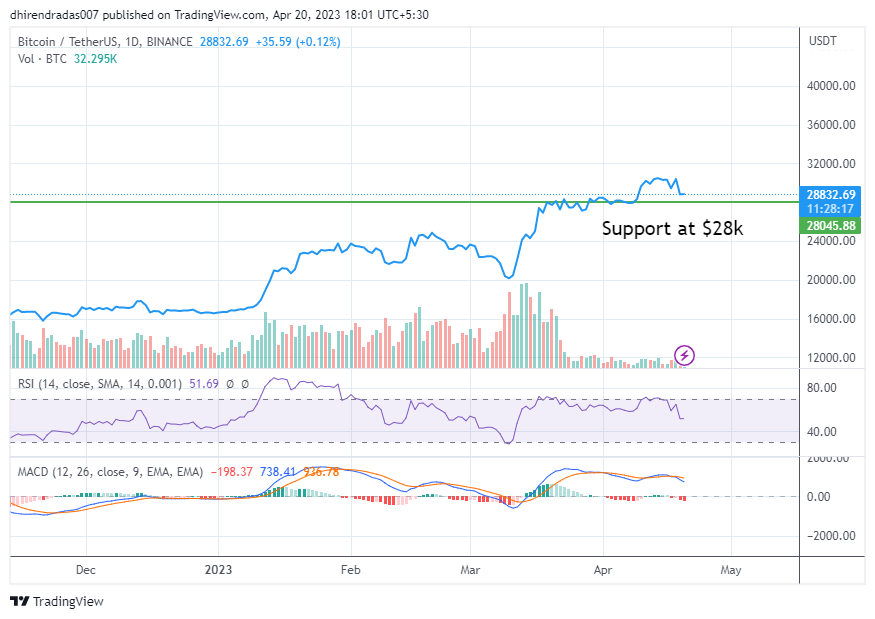
Bitcoin is sharply falling toward $28k, which is a support zone. If BTC falls below $28k, it will pause the bull run that began around $20k for a while. The chart setup also indicates a shorting opportunity.
- RSI is at 50 and is in a downtrend.
- MACD has shown a negative crossover.
- Volumes have shrunken.
- The current price is below its 20-DMA, which signals short-term bearishness.
We can short BTC at current levels.
Bearish Targets: $27,300
Stoploss: $29,350
Ethereum Price Analysis

Ethereum was very close to crossing a major hurdle at $2,155. It has been in a bullish flag chart pattern. Currently, it has maintained a positive trend, which began on Jan 01, 2023. If it continues the trend, it will break major resistance at $2,155.
However, the technical indicators show mixed signals.
- Sharp fall in RSI.
- A negative crossover is about to happen in MACD.
- Volumes are consistent with net sellers.
- A bullish flag chart pattern is forming in daily charts.
Ethereum can be bought at current levels but only for investment for a period of 4-5 weeks. The bullish flag pattern and the record number of users, make it an attractive investment.
Disclaimer: Voice Of Crypto aims to deliver accurate and up-to-date information but will not be responsible for any missing facts or inaccurate information. Cryptocurrencies are highly volatile financial assets, so research and make your own financial decisions.