Key Insights:
- The Cup and Handle Pattern were completed in Polygon’s weekly charts.
- Recently broke out of Symmetrical Triangle Pattern.
- 50%-100% upside possible in prices.
- Polygon shows strong fundamentals.
Polygon might see a 50%-100% upside in prices as its weekly charts show the successful formation of the Symmetrical Triangle Pattern as well as the Cup and Handle Pattern. The price might soon cross $2 if the markets stay bullish.
With strong fundamentals, partnerships, and upcoming events, Polygon is poised to show strong growth in both its network and the price of its cryptocurrency.
Cup and Handle Pattern in Polygon’s Weekly Charts
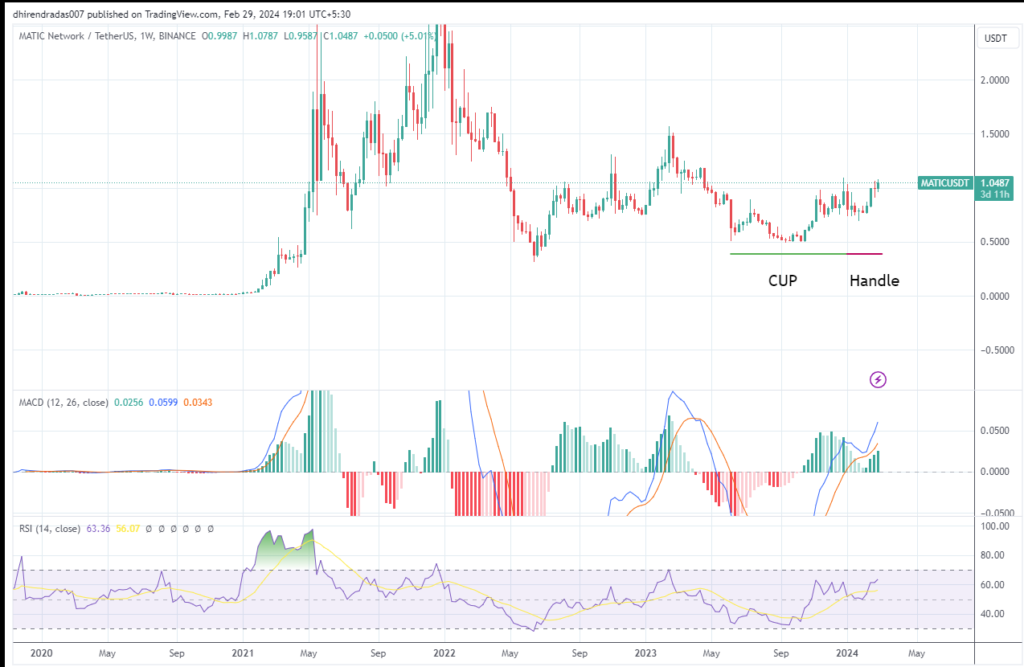
The weekly chart of Polygon (MATIC) has shown the formation of a cup and handle pattern. The cup started its formation in June 2023 and finished by Jan 2024. The handle part of the pattern started forming in Jan 2023 and finished by mid-Feb 2024.
The cup and handle is a very strong bullish pattern and usually forms before a massive upward movement in prices. The pattern is usually made up of two U-shaped parts which are the cup and the handle. A complete cup and handle should be in a way so that the deepest point in the cup is lower than the deepest portion of the handle. Also, the width of the cup should be much smaller than the width of the handle.
In the case of Polygon, in 2024, both these conditions are satisfied. The deepest point inside the cup part was at $0.5 while the deepest part inside the handle was at $0.77. Also, the wide width of the cup (6 months) was much larger than the width of the handle (1.5 months).
The formation of this pattern indicates that prices might break out its next major resistance at $1.5 and then at $1.7.
Polygon Also Breaks out of Symmetrical Triangle
Another bullish pattern that was seen forming on Polygon’s weekly charts was the breaking out of prices from the Symmetrical Triangle. In this pattern, the price first moves in a zig-zag manner and it appears to stabilize as it moves ahead.
This pattern started forming around almost a year back in March 2023. The pattern’s end was supposed to be around March 2024. However, the price soon broke out on the upside on Feb 12, 2024, with clear confirmation in the current week (Feb 26-Mar 03).
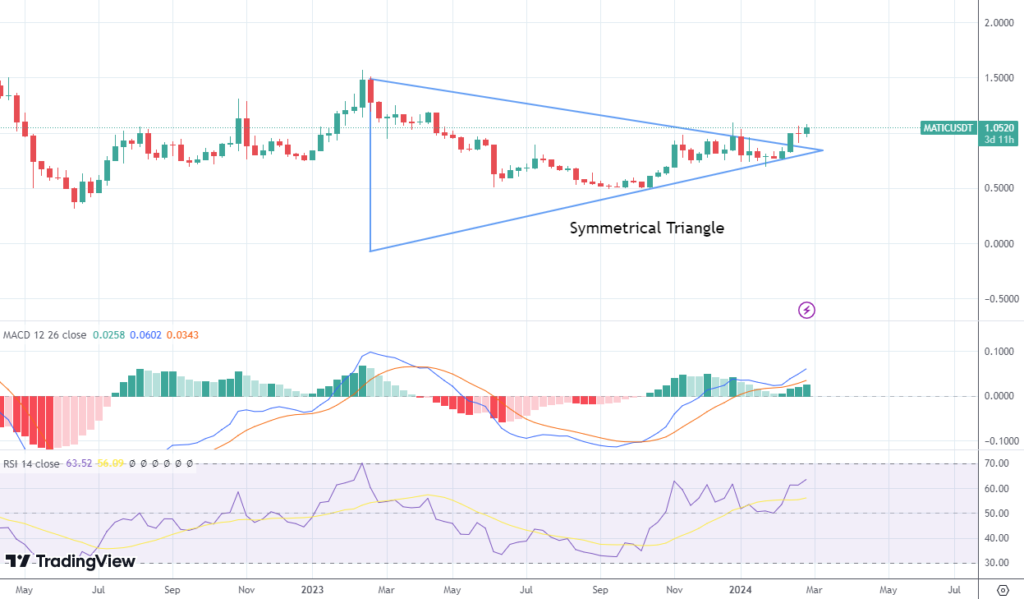
Upon the formation, it seems that Polygon’s price might break $1.5 and even go toward $1.7. If the overall markets remain euphoric, the price might even cross $2.
Technical Indicators Also Indicate a Bullish Upmove
Technical indicators too support the bullish up move that is indicated by Polygon’s weekly charts.
- RSI on these charts is now at 63 which indicates that the price has not yet gained its full momentum which would be around an RSI of 80 or more. Also, an RSI of 63 is a decent starting point for a rally. If it were to be around 40 or less, there was a chance that the rally might have fizzled out.
- MACD also shows that the moving averages are higher on shorter timeframes which indicates an increase in price momentum in the recent few weeks.
Significance of Weekly Charts as Compared to Daily Charts
Weekly charts are more significant and accurate than daily charts as they help navigate larger trends in the crypto markets. Weekly charts are mostly used by investors and long-term traders.
At VOC, we use weekly charts when price analysis is to be done for longer timeframes such as a few months or a year.
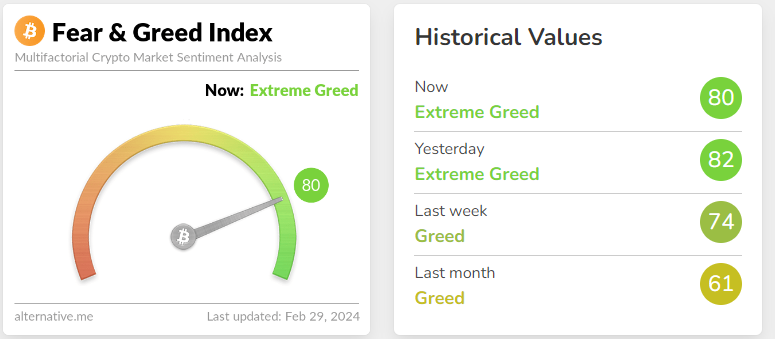
Beware of Market Volatility
As the fear and greed index rises to new highs, the markets are expected to grow even more volatile. We suggest you trade with caution as markets move to new highs.
The crypto fear and greed index was also at a decent high level at press time. At such levels, price corrections might occur at times.
Finally, the successful completion of patterns is not a guarantee of price movement. Other factors impact the prices such as news, regulations, technology, unexpected failures, and breakdowns, to name a few.
Disclaimer: Voice of Crypto aims to deliver accurate and up-to-date information, but it will not be responsible for any missing facts or inaccurate information. Cryptocurrencies are highly volatile financial assets, so research and make your own financial decisions.