Bitcoin valuation models based on mining energy costs indicate BTC is trading 70% below its fair value of $175,400, creating a significant discount at current prices near $95,000. Long-term on-chain indicators like the MVRV Z-Score have dropped to 14-month lows, signaling strong accumulation interest from holders.
Key Insights
- Energy-driven valuation models are showing that Bitcoin is trading far below its fair value.
- Long-term indicators indicate that there is strong accumulation interest at current levels.
- The price charts are showing pressure near important support zones as traders wait.
Bitcoin energy models are signaling a major disconnect as the cryptocurrency sits near price levels that have drawn the attention of traders, analysts, and long-term holders who believe current prices represent deep undervaluation.
These models are now showing a large gap between the market price and what many analysts see as the coin’s fair value based on production economics.
Several on-chain signals are also pointing toward conditions that align with accumulation periods.
Are Bitcoin Energy Models Signaling Deep Undervaluation?
More and more analysts are relying on energy-based models to estimate fair value for Bitcoin. These models use the cost of electricity, hardware efficiency and miner behavior to outline a theoretical value range for each coin.
Bitcoin valuation models that incorporate energy inputs have gained credibility among institutional analysts because they tie price expectations to measurable production costs rather than speculative sentiment alone
BREAKING: #Bitcoin Is 31% Undervalued. Nasdaq Correlations Points to a $156K Fair Value. Price Manipulation by big actors at its finest. pic.twitter.com/nAhu5Vm0D7
— Carl ₿ MENGER ⚡️🇸🇻 (@CarlBMenger) October 22, 2025
One of the more widely followed Bitcoin valuation models comes from Capriole Investments, which incorporates real-time mining efficiency data and global energy prices. According to this model, Bitcoin should trade near $175,400 based on the current cost of mining. Energy expenses have climbed, yet the market has moved in the opposite direction.
According to this approach, the coin trades at a discount of roughly 70%.
These models assume that miners act in a way that aligns with long-term incentives. When mining becomes too expensive, weaker miners shut down their machines. That reduces total energy use, lowers difficulty at each adjustment cycle, and balances the cost per coin.
Price then tends to move toward the energy value over time. The process works the other way as well when the price rises. More miners join the network, difficulty increases and the energy required per coin climbs. These Bitcoin valuation models assume rational miner behavior over time, where production costs eventually converge with market prices as network difficulty adjusts to maintain economic equilibrium.
Energy-based valuation isn’t the only model revealing major discrepancies. Even macro-driven forecasts are shifting—Cathie Wood recently cut her Bitcoin price prediction by $300,000, reflecting how changes in institutional flows and long-term adoption assumptions are reshaping market expectations.
Why Does Energy Valuation Often Track Price Over Time?
Bitcoin’s protocol adjusts difficulty every 2,016 blocks. The goal is to keep the average block time near 10 minutes. When mining participation drops, difficulty adjusts downward. And when participation rises, difficulty climbs.
This mechanism links miner costs to market conditions. If price stays under miners’ break-even levels for long periods, mining activity slows.
The network then reduces difficulty, which lowers energy needs per block. If the price rises, more miners join. That pushes energy use higher, which then raises the energy valuation.
This cycle explains why price and energy often converge. Energy use now shows the cost that miners absorb to secure the network. Since miners must remain profitable, their behavior affects market supply. If the energy model shows a large gap, it usually closes within months.
Bitcoin Long-Term Indicators Also Signal Undervaluation
When Bitcoin valuation models diverge significantly from spot prices, as they do currently, historical patterns suggest the gap typically closes within several months as the market reprices the asset. One of these metrics (the MVRV Z-Score) recently dropped to a 14-month low, according to Glassnode.
This indicator compares market value with realized value, which measures the price of coins when they last moved on-chain. Low readings often appear during deep consolidation periods.
These moments have marked a strong accumulation of interest in past cycles.
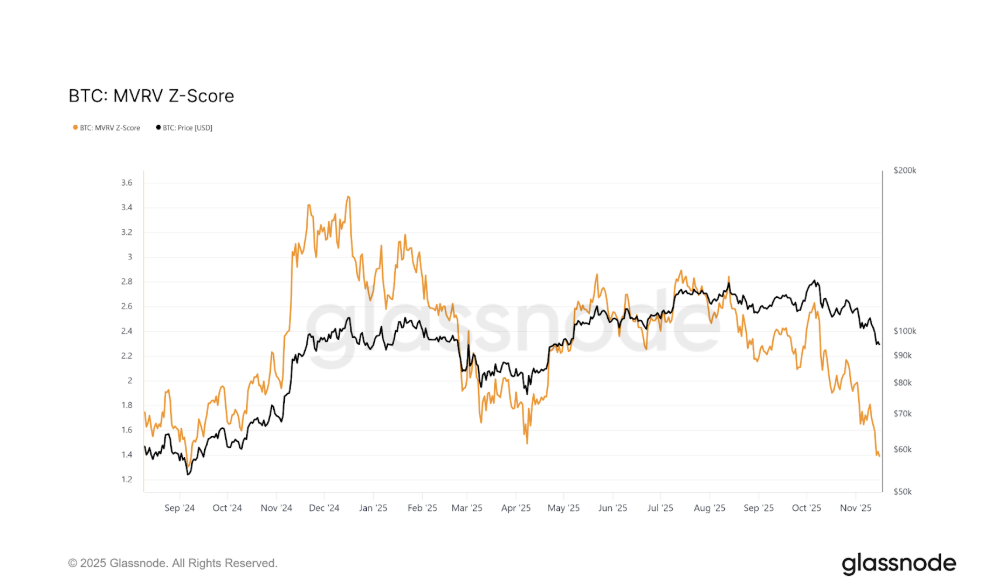
Long-term holders tend to add to their positions when the MVRV Z-Score enters undervalued regions. Fresh demand then gradually builds and produces enough pressure to stabilize the price.
Dominance metrics are also showing a trend. Bitcoin’s dominance fell from more than 65% to around 59%. The decline, paired with a bearish crossover in the Stochastic RSI, shows signs of weakening strength.
This does not imply that a massive drop is underway. Instead, it can mean that traders are cautious and waiting for clarity.
Current Market Action Near Support Levels
Bitcoin currently trades near $95,000 after a steady pullback. The decline sped up after the price slipped below a head and shoulders structure on the chart. That pattern points toward a target near $89,407, which sits below the current range.
Despite Bitcoin valuation models suggesting fair value above $175,000, technical price action continues to test support levels as traders await clearer directional catalysts.
Support near $90,000 now plays a major role. Traders want to see whether buyers defend this level or allow the price to test lower support areas. If sellers stay active, the asset may drift toward the target of the bearish pattern.
If buyers step in, the price could recover toward $100,000.
That move would reduce pressure, weaken the bearish structure, and support a possible attempt toward $105,000.
Mining Difficulty, Halving Cycles and Supply Dynamics
Mining difficulty continues to adjust as miners react to price swings. When profitability drops, some miners pause activity. When price recovers, they return. These adjustments were intentionally put in place to make block production steady.
To sum things up, Bitcoin valuation models based on energy costs are now showing a large gap of approximately 70% between mining costs and market price, creating what many analysts view as a compelling entry opportunity.
Difficulty also seems to be adjusting to balance miner economics.
The short-term charts are showing signs of pressure, as more indicators point toward levels below the current price.
The next few weeks will determine whether buyers view the present range as a chance to add or whether sellers keep pressure on markets.
If accumulation strengthens, the asset could attempt a recovery toward six-figure levels. If selling continues, the price could drift closer to the pattern target.
Disclaimer: This article is intended solely for informational purposes and should not be construed as financial advice. Investing in cryptocurrencies involves substantial risk, including the possible loss of your capital. Readers are encouraged to perform their own research and seek guidance from a licensed financial advisor before making any investment decisions. Voice of Crypto does not endorse or promote any specific cryptocurrency, investment product, or trading strategy mentioned in this article.