Key Insights:
- Solana has completed a cup and handle pattern on the weekly charts.
- The pattern could take SOL beyond $440 in the short term.
- Strong fundamentals could see Solana hit $1000 in the next year.
- SOL is around 7% away from making a new ATH.
Short Term Targets at $440, Medium Term at $1000
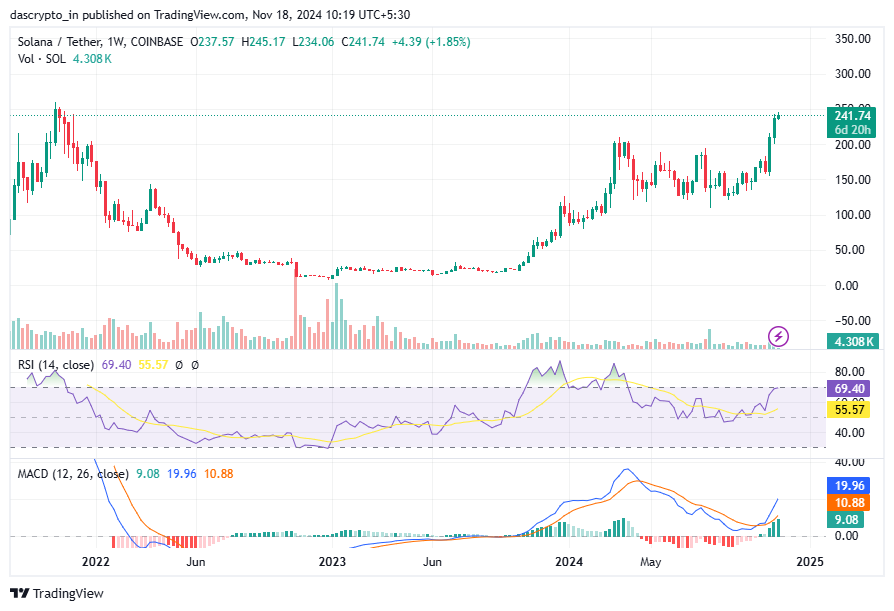
A cup and handle pattern has been completed on Solana’s weekly charts. This pattern is highly bullish and could take SOL beyond $440.
Further, SOL’s growth in the last couple of years and its fundamental developments could help it cross $500 in the near term and $1000 in the medium term.
Various experts have already predicted a high rate of price growth in SOL.
Solana Recent Price Trends
Solana has been a consistent gainer in the crypto markets in the last couple of months despite changing trends. The price of SOL held on to $125, its bull market support level, even when other cryptos, like DOGE, SHIB, and XRP, lost heavily.
This month SOL not only crossed above $200, but also recovered its 2024 high of $209. Further, as Bitcoin nears $100k, Solana is close to making a new ATH (previous ATH of $260). At press time SOL was at $241, up by 16% over the week.
Solana Completes Cup and Handle
We are confident in SOL’s ability to make a new ATH this month because of its weekly charts, which saw the completion of the super bullish “Cup and Handle” pattern. This pattern usually forms before a super rally takes place in any crypto.
Further, patterns formed in weekly charts are much stronger than those formed in small timeframes like daily or hourly charts. Also, bullish patterns on weekly charts are barely disturbed by small microtrends in the markets, even if they are in the opposite direction.

SOL/USDT Charts on Tradingview
In the current case, Solana saw the formation start in July 2022 when SOL’s price was around $15. The pattern ended with Solana’s price at $200. The breakout took place on
Further, Solana’s technical indicators indicate that the rally could intensify, as it seems from RSI and MACD. The Relative Strength Index could help SOL’s momentum rise from this week as the indicator is about to cross 70 levels. Above 70 RSI is considered much more bullish. Turning to MACD, we see it has already made a crossover on 14 October, i.e., last month.
Usually, the growth spreads over a few weeks in such multi-year patterns. Based on these expectations, SOL could cross $260, its last ATH before the end of November 2024, and could end upwards of $440 by the end of January 2025.
What Supports SOL’s Growth Fundamentally?
Solana’s price has seen an uplift not only because of technical trends. Several fundamental trends help SOL conquer higher price levels and put stiff competition to Ethereum.
First and foremost, Solana has eliminated all its troubles since its creation in 2020. These included security issues, lack of liquidity, and heavy concentration in whale accounts. The most troubling issue was the frequent outages on the blockchain.
Second, Solana has scaled up its blockchain to over 65000 transactions per second without relying on any layer-2 chain or off-chain protocol. Its max recorded TPS lies near 7900 transactions, and real-time usage is around 4000 transactions per second. This means Solana can see its usage rise much higher before thinking of increasing its scalability again.
Third, Solana has one of the largest memecoin markets on its blockchain. The market is highest in terms of projects with decent traction and is the second highest after Dogecoin and Ethereum.
Fourth, Solana has a very mature DeFi ecosystem with around $7 to $8 billion in total value locked. Though this is much less than Ethereum, it is the second largest platform.
Note: Dogecoin has its own blockchain and currently has a market cap of $58 billion.
Finally, the news of an ETF by Van Eck also pushes Solana higher.
SOL Price Levels To Watch
Solana has now crossed $240 and is on its way to crossing the ATH, which is around 7% away. After it crosses the ATH, the crypto is expected to see a big breakout under the quadruple influence of cup and handle, ATH breakout, RSI momentum breakout, and the positive MACD crossover.
We expect further gains to occur with some in-between corrections (less than 10% drawdowns); hence, there will not be a FOMO-led flash rally as we see now in Bitcoin.
Disclaimer: Voice of Crypto aims to deliver accurate and up-to-date information, but it will not be responsible for any missing facts or inaccurate information. Cryptocurrencies are highly volatile financial assets, so research and make your own financial decisions.


