MATIC price has been on an upward trend for the past week. Despite that, it has been unable to break past the $1 psychological level. Technical indicators are sending strong signals that suggest a move towards the $1 price ceiling.
MATIC has been on an upward trajectory over the last week, with prices gaining 22% since then. On a daily basis, MATIC is up 7%. MATIC briefly touched the $0.97 mark before falling back down slightly due to reduced buying strength. The buying strength was positive, showing that bullish momentum hadn’t faded.
With a pullback, MATIC could be brought down to $0.77. If the coin continues gaining strength, it could break past the psychological price ceiling of $1. MATIC is currently trading above the $0.75 support line.
The global cryptocurrency market cap is at $1.09 trillion, a 2.6% positive change in the last 24 hours.
MATIC Price Analysis: Four-Hour Chart
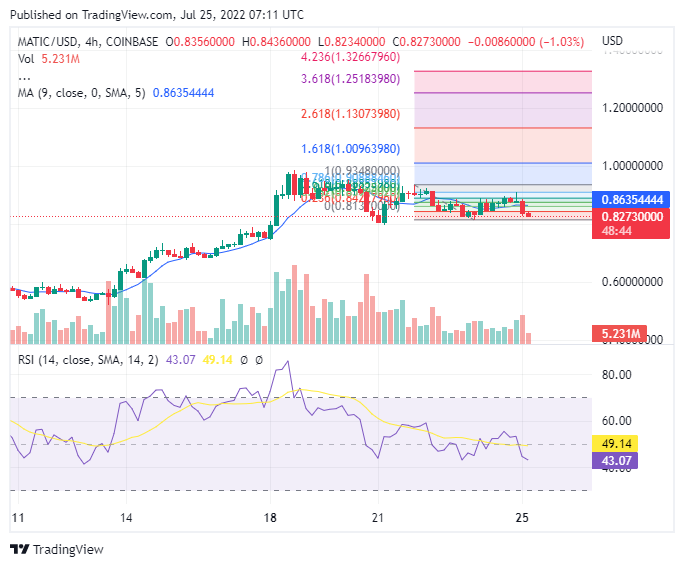
The altcoin is currently trading at $0.87, but it has been volatile and touching the $0.97 mark for a few minutes before being sold off again. The overhead resistance for MATIC is $0.92, which could force the price to touch the $1 mark.
With the local support at $0.77, it is possible that MATIC could fall to $0.60 in value if this level falls further. MATIC traded over the last trading session fell slightly, indicating that buying strength has started declining.
The coin has visited an overbought zone, but as it fell in value, buying strength dipped too. At the time of writing, there are more buyers than sellers for this altcoin.
An index picture of the Relative Strength Index was drawn above half-line, which meant that buyers were in more significant numbers.
The altcoin price was above its 20-SMA line, which indicates buyers were in control. This means we can expect more gains soon.
As you can see, the technical indicator displayed a slight dip in buying strength for the altcoin. The Moving Average Convergence Divergence is an indicator that shows whether prices are trending upwards or downward. MACD underwent a bearish cross and formed red signal bars, which means the trend might be changing soon.
The red signal bars represent a sell indication for altcoins. The Awesome Oscillator is a technical indicator that plots the price movement and indicates whether there’s an opportunity for a turnaround, with green bars representing a solid bullish trend.
The coin has been keeping up with the pace, and buying strength will likely continue to support MATIC. Broader market trends should also help this altcoin reach its psychological target of $1.