We have brought you a few trending cryptocurrencies that are in a bullish mood. These coins have shown massive price action and are getting ready for a good rally ahead.
We have used price analysis to check if they have some trading opportunities in them.
Arbitrum (ARB)
ARB is the governance token of the Arbitrum Layer-2 scaling solution for the Ethereum blockchain. Recently it has been surging in price with 11% gains in the last 24 hours. The reason is ARB is getting listed on Binance today. Let us explore if there is any scope for further price rise.
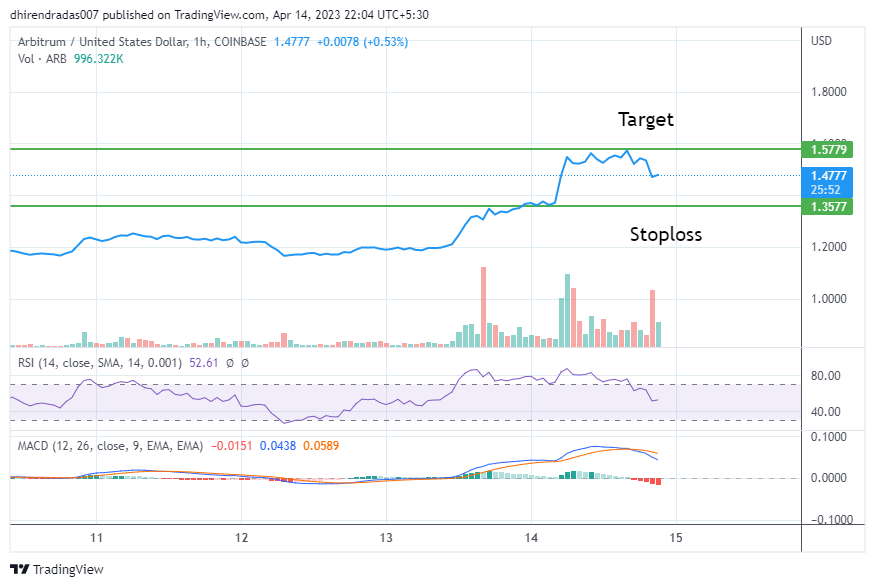
On Daily Charts, the data is too low because of its recent launch and no history. We have switched to hourly charts for greater insights.
ARB has reached a resistance level and is now falling with a clear indication.
- RSI is cooling down from oversold and is now stable at 52.
- MACD has shown a negative crossover.
- Volumes have been more on the sell side recently.
Overall it makes a good candidate for shorting.
Target and Stop loss
Target: $1.35
Stop loss: $1.57
Time: 1 -2 days
Loopring (LRC)
Loopring had earlier shown a sudden 25% spike due to its good results as a Layer-2 solution combined with Shapella(Shanghai) Upgrade. The coin shows the perfect trade setup for a buying opportunity. On the daily charts, RSI, Volume, MACD, and Chart Patterns are looking great.
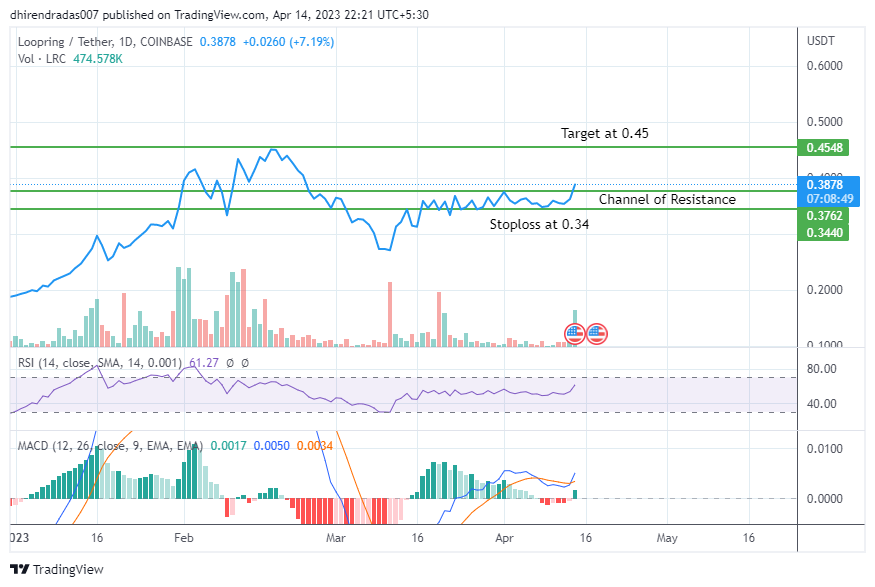
- RSI is getting stronger and has still not entered the overbought zone(>70).
- Volume is huge, with a large positive buying on Coinbase.
- MACD is positive and extremely bullish.
- The price has crossed a narrow channel of resistance between $0.37-$0.38
Target and Stop loss
Target: $0.45
Stop loss: $0.37
Time: 1 week
Optimism (OP)
Cryptocurrency Optimism has gained more than 6% in the last 24 hours. Much of the gains can be attributed to a successful Shapella upgrade that took place recently. Optimism is one of the most popular Layer-2 solutions for Ethereum besides Polygon and Arbitrum. The cryptocurrency has been trending after Shapella upgrade was successful.
Let us explore technical indicators to see if there are any opportunities for trading Optimism.

On technical charts, Optimism is showing a very lucrative trading opportunity.
- RSI is getting stronger but has still not entered oversold territory.
- MACD has shown a positive crossover.
- Trading volumes are higher than in recent times and are net positive.
- The price has broken a channel of resistance near $2.25.
Target and Stop loss
Target: $3.06
Stop loss: $2.25
Time: 1-2 weeks
Lido Dao (LDO)
Lido is the biggest liquidity provider to ETH Staking and one of the main gainers after the Shapella upgrade since it is expected to witness both staking and withdrawing of staked ETH. Its governance cryptocurrency is the Lido DAO and it shows a nice chart pattern. The cryptocurrency has been trending since a few days.

Technical indicators on daily charts show that:
- RSI is moderate at 55. It is expected to grow as there is a double bottom pattern on RSI graphs.
- MACD is about to show a positive crossover.
- Volumes are neutral.
- A symmetrical triangle pattern has formed in the graph with a minor double bottom forming. if the price breaks above the upper arm of the triangle, there will be a nice rally ahead.
Target and Stop loss
Target: $3.30
Stop loss: $2.33
Time: 1 week
Aptos (APT)
APT is the native token of the Aptos Ecosystem that wishes to create a better and user-oriented blockchain. It has also been under controversy due to its tokenomics. The cryptocurrency has been trending and has shown nice gains during the first half of the day, but all gains have been wiped out now.
Let us use technical analysis to see if there is a trading opportunity.

Technical indicators show that:
- RSI is bouncing back from the levels of 40-45, which is a good indicator.
- MACD has shown a positive crossover.
- Volumes are consistent.
- The chart shows a symmetrical triangle pattern formed over the last six months. If this breaks on the upside, it can push the cryptocurrency into a larger rally.
Target and Stop loss
Target: $18.5
Stop loss: $11
Time: 4 to 5 weeks
Disclaimer: Voice of Crypto aims to deliver accurate and up-to-date information, but it will not be responsible for any missing facts or inaccurate information. Cryptocurrencies are highly volatile financial assets, so research and make your own financial decisions.