
Key Insights:
- Bitcoin has declined by 4% in the last 24 hours and is currently trading at $24,966.
- The decline in Bitcoin’s price has been caused by several factors, including the recent Federal Reserve rate rise announcement, and the de-pegging of Tether’s stablecoin, USDT.
- Despite the bearishness, there are some bullish signs for BTC, such as the decline in exchange reserves and the increase in open interest.
- If BTC is to recover, it will need to break through the $25,400 – $25,700 zone.
- If BTC breaks through this zone, it could rebound to $30,000 or higher.
The largest cryptocurrencies on the market have been trending lower over the last 24 hours, and there appears to be no end.
BTC, the largest cryptocurrency by market capitalization, declined by as much as 6% before normalizing to a 4% drop.
Ethereum (ETH) on the other hand, the world’s second-largest cryptocurrency, fell by an even bigger 6.1% in a single trading day, and is struggling with an 11% weekly drop.
The crypto market‘s bearishness follows the recent Federal Reserve rate rise announcement and was further worsened by the recent de-pegging of Tether’s stablecoin, USDT on Thursday, 15 June.
For the first time in almost a year, the Fed has kept its interest rates stable.
Despite this, Inflation has stayed above the central bank’s 2% target.
All of this is without addressing how USDT lost its $1 peg on June 15th due to certain anomalies on Curve’s 3Pool.
In this article, we jump into BTC and see what has been going on with Satoshi Nakamoto’s creation.
Bitcoin Spot Price Action
At the time of writing on 15 June 2023, CoinMarketCap data shows that the price of BTC currently sits at $24,966. This means that the cryptocurrency has lost almost $1,000 over the last 24 hours, in a 4% dip. CoinMarketCap data also shows that the volume of BTC traded in the last 24 hours sits at $17.3 billion.
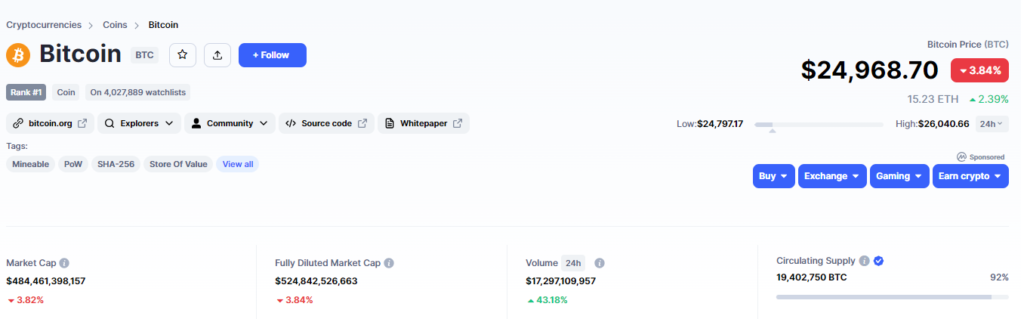
Bitcoin spot metrics | Source: CoinMarketCap
While BTC started its 24-hour journey at $26,098.0, it has since declined to $24,797 before normalizing around the $24,900 zone.
The fact remains that the cryptocurrency has lost its footing around the $25,000 zone and will now struggle to reclaim this zone.
On the 4-hour chart, the price is trading inside a descending channel, and is in a downtrend as illustrated below:
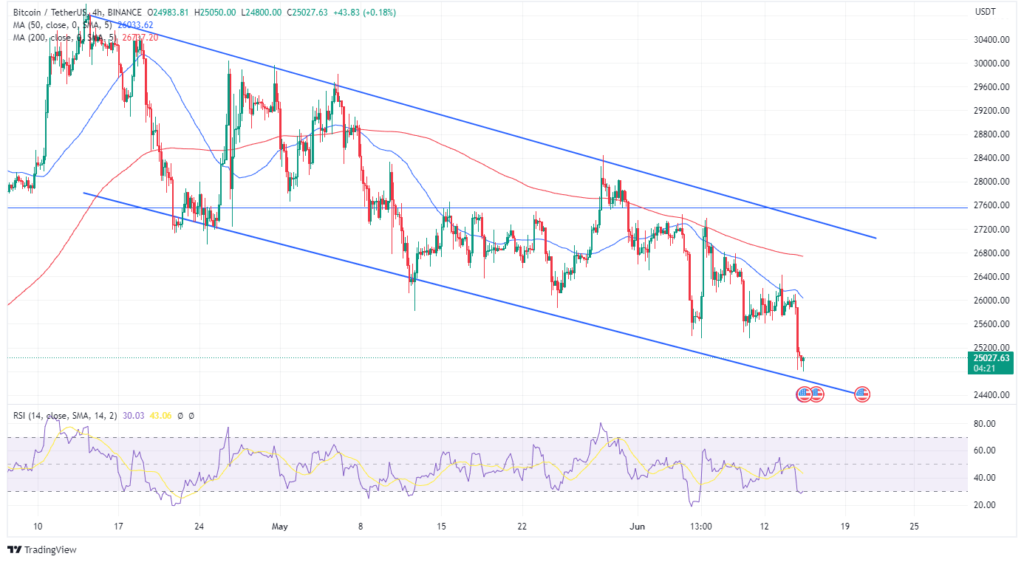
Overall, as seen above, the recent decline in Bitcoin’s price has brought the cryptocurrency into a retest of the channel’s lower resistance around the $24,900 – $24,700 zone.
This means that the $24,700 zone is likely one of the most important support zones to keep an eye out for, because if this zone breaks, BTC may decline straight down to $21,000 or lower.
Overall, the RSI is showing oversold conditions, indicating that a price reversal may be on its way.
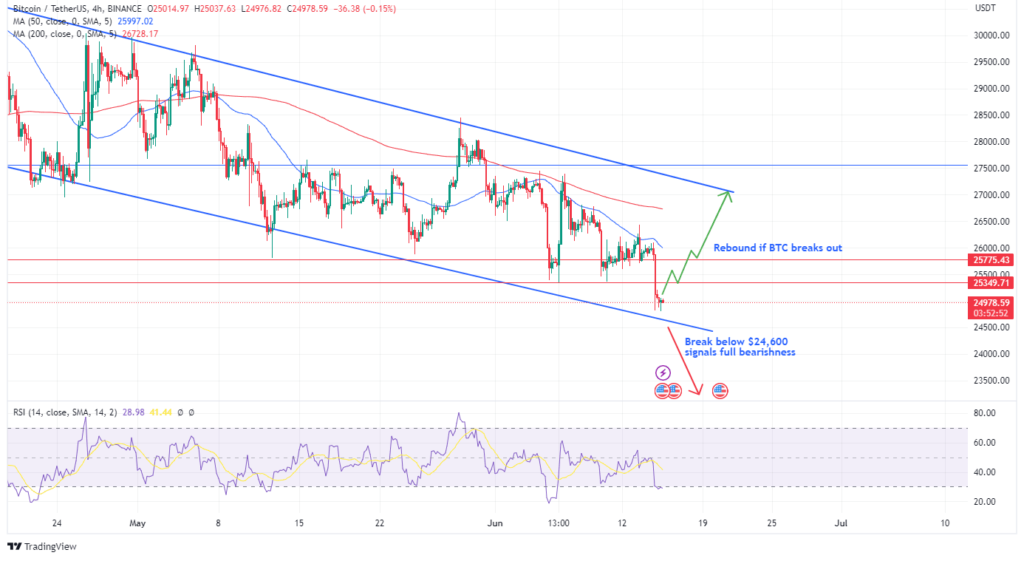
If BTC will ever have a chance of recovery, one of the first zones to break would be the $25,400 – $25,700 zone.
If BTC successfully breaks through these zones, there may be a chance of a rebound to $30,000 again or even higher.
Bulls Lose 142.8 Million To Bitcoin Liquidations
According to data from CoinGlass, the past 24 hours have not been favourable to Bitcoin’s bulls.
The +4% decline in the cryptocurrency caused a massive wave of liquidations for BTC bulls who had long trades open, leading to millions of dollars in losses.
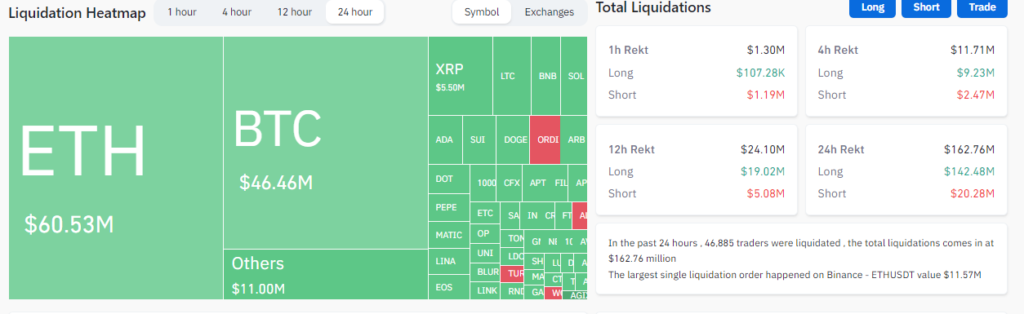
According to CoinGlass data, 46,885 bulls have lost $142,48 million over the last 24 hours, leading to a total liquidation value of $162 million across Bitcoin.
This is bad news, because bulls on Binance alone lost $41.6 million, and bulls on OKX lost $40.4 million.
Despite the bearishness, however, Bitcoin may bounce off the $25,400 – $25,700 zone, because:
Bitcoin Exchange Reserves Spiking?
After reaching resistance at the $30K mark, Bitcoin’s price has entered a correction phase. This correction might be the result of investors taking advantage of the climb from the $17K zone to sell their coins at a better price.
Taking a deeper dive into the exchange reserve metric, however, we see a shift in the market’s behaviour.
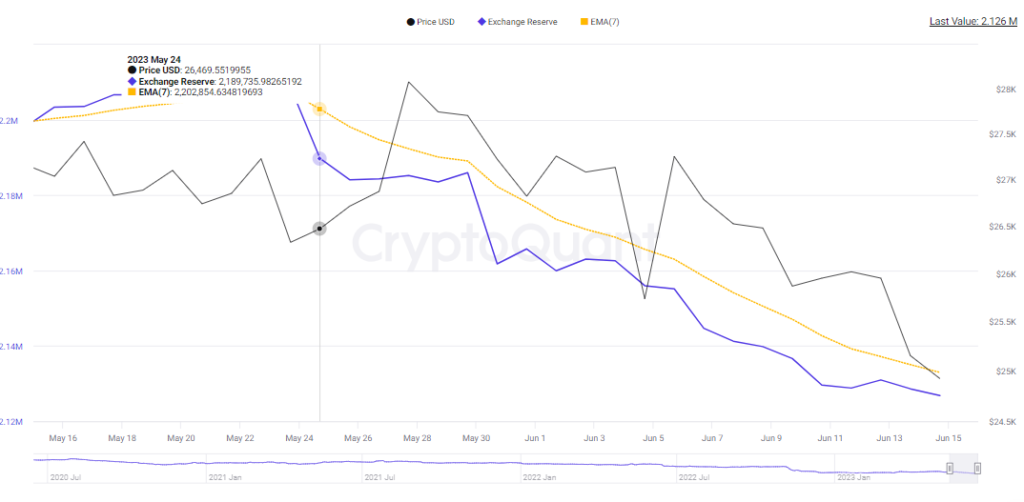
And as we can see in the chart above, the exchange reserves metric (blue line) is on a steady decline. This means that more people are taking their Bitcoin off exchanges, and may be storing, rather than selling.
If this trend continues, the decrease in supply and the (possible) increase in demand might lead to an upward trend in the coming weeks.
Open Interest Backs Bullish Verdict
Open Interest is another metric that helps us understand what might be going on with Bitcoin.
When Open Interest (OI) goes up, it means that more liquidity, volatility, and attention are entering the market. The reverse is the case when it comes down.
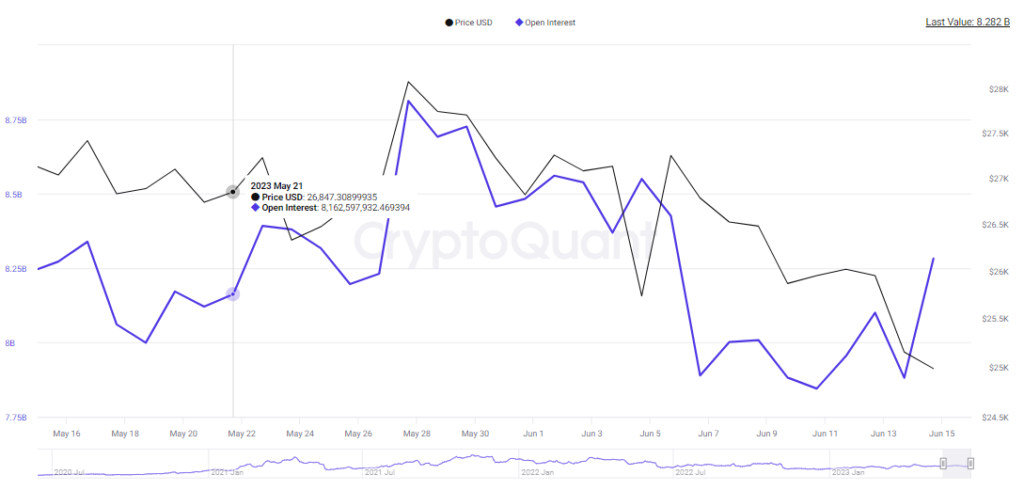
As illustrated above, Bitcoin’s open interest (blue line) remains on the rise, despite the decline in its price (black).
This means that new traders are entering the market, and Bitcoin make regain some of its past glory.
Where To For Bitcoin From Here?
To answer this question, we may have to employ Fibonacci retracements on the daily chart.
Drawing out the retracement from the $15,500 FTX low in November 2022, we can obtain some very interesting price levels as illustrated below:
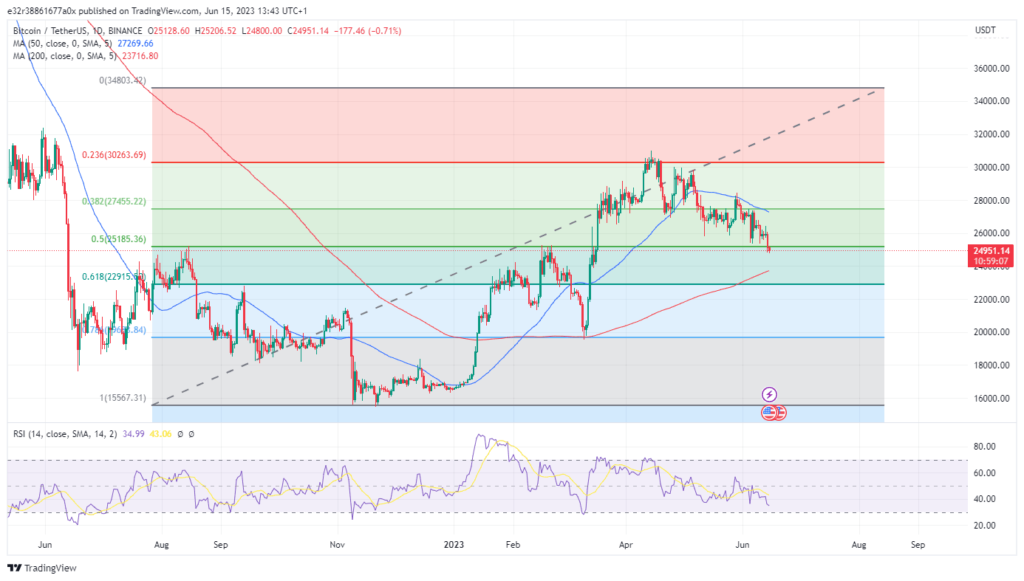
From the above, we see that Bitcoin may have just crossed a line.
The 50% FIB level marked the $25,200 zone, and Bitcoin just lost its footing around this zone.
This means that Bitcoin may decline towards its 200-day SMA around $23,750 before moving up again.
Overall, our bullish price targets are:
- $25,185 (50% FIB)
- $27,455 (38.2% FIB)
- $30,263 (23.6% FIB)
- $34,800 (0%)
In the case of a bearish scenario, the likely places to look out for are:
- $23,750 (200-day SMA)
- $22,915 (61.8% FIB)
- $19,698 (75.6% FIB)
Disclaimer: Voice of Crypto aims to deliver accurate and up-to-date information, but it will not be responsible for any missing facts or inaccurate information. Cryptocurrencies are highly volatile financial assets, so research and make your own financial decisions.