Key Insights:
- Bitcoin has suffered from massive selling pressure since hitting $31,000
- If a breakout from the next key resistance zone happens, BTC will rally straight up to $29,800.
- Price targets include $29,824, $32,206 and $36,055
BTC, the flagship cryptocurrency, has been through a series of ups and downs, ever since breaking below the $60,000 zone in May 2021 and the $40,000 zone in December 2021.
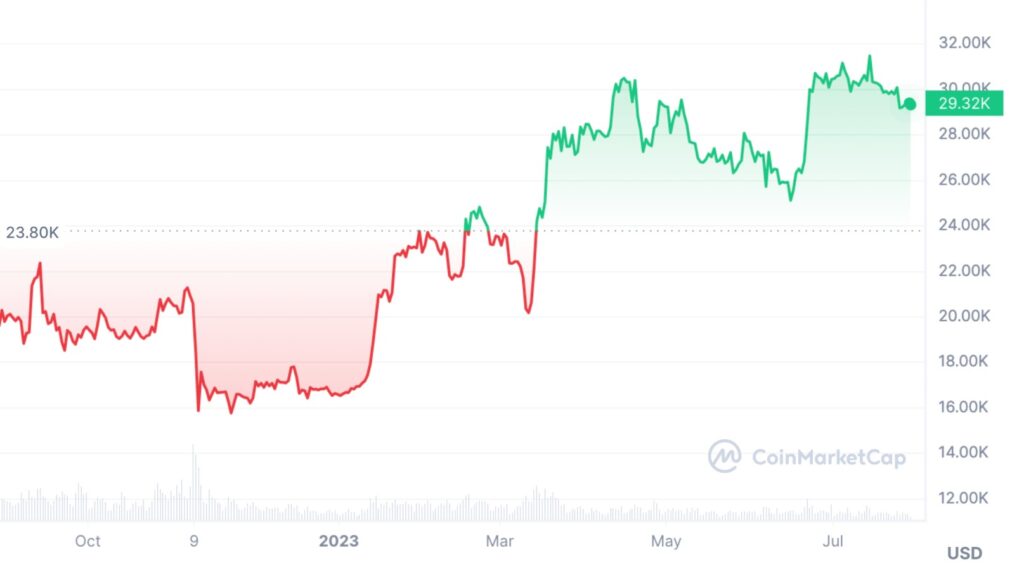
The cryptocurrency has been stuck in a bear market ever since and has spent the better part of this year between $15,500 and $31,000.
2023 has been nice, so far, to BTC. The cryptocurrency has outperformed the stock and index market from January 2023 till date and is going strong with a +70% YTD (year to date) price increase.
However, the $30,000 zone is proving to be a difficult ocean for BTC to cross, and all eyes are on the crypto market.
In this article, we examine whether this gets to be the week that Bitcoin breaks through $30,000. We will talk about how and when this breakout will happen, the significance of this resistance zone, and which price targets you should keep an eye out for.
Let’s jump right in, shall we?
Bitcoin Price Analysis
To put things simply, ever since BTC got driven down from the $31,000 zone, the cryptocurrency has suffered from massive selling pressure.

The rejection from $31,000 drove the price of BTC straight down into a retest of the $26,000 zone in June.
This time, however, BTC has maintained relatively higher price levels.
So far, BTC has been playing hide and seek with the $30,000 mark but appears to be having some minor trouble going beyond it.
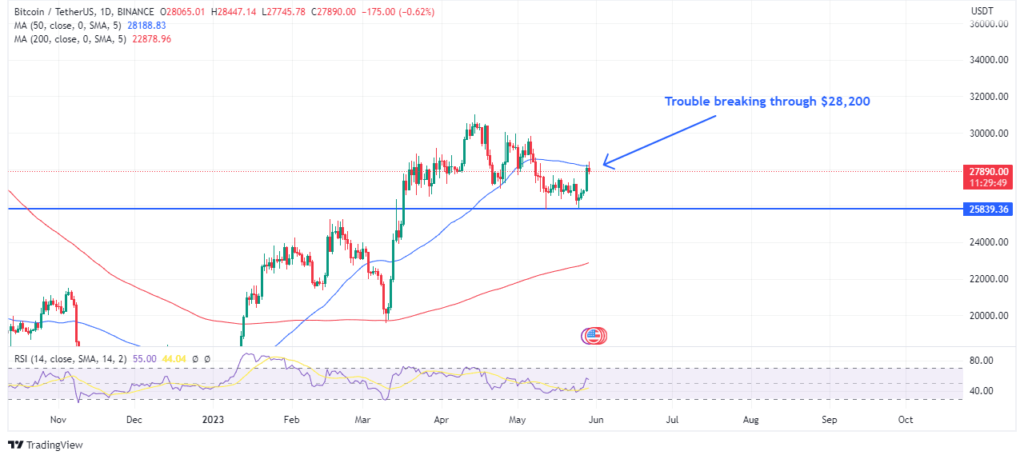
If Bitcoin price keeps up above the $28,200 mark which acted as a strong resistance in June there could be some relief for BTC HODLers.

The cryptocurrency is bullish over the daily and weekly timeframes though.
CoinMarketCap calculates that BTC traded at $29,301.80 at press time, up 0.12% over the last 24 hours, but down by over 1.50% in the last seven days.
On the charts, BTC is still well over its 200-day moving average, which is a good sign.
Bulls may be encouraged to buy more Bitcoin and open more trades in the short term. More trades equals more fuel for BTC, which may be one of the first signs BTC is ready to revisit the $30,000 zone.
Bitcoin’s Chances Of Breaching $30,000?
What are Bitcoin’s chances of breaching $30,000 again this week?
We would say that these chances look good. A descending trendline can be drawn on the charts.
This trendline has been valid since Bitcoin’s initial rejection from $31,000. And it so happens that this trendline is directly on top of the cryptocurrency’s 50-day MA.
What does this mean?
It means that the $28,200 zone is a very important one. If the bulls push the price of BTC into a breakout from this zone and a daily close above it, several other bulls are bound to open trades.
These trades will become more bullish fuel, and BTC may even break the $30,000 – $31,000 zone.
The RSI on the daily chart is right above the neutral zone, suggesting that the bulls currently have the upper hand. And if a breakout from $28,200 happens, BTC will not only hit $30,000 this week.
It will likely break right above it.
Bitcoin’s Likely Price Targets
You should pay attention from here.
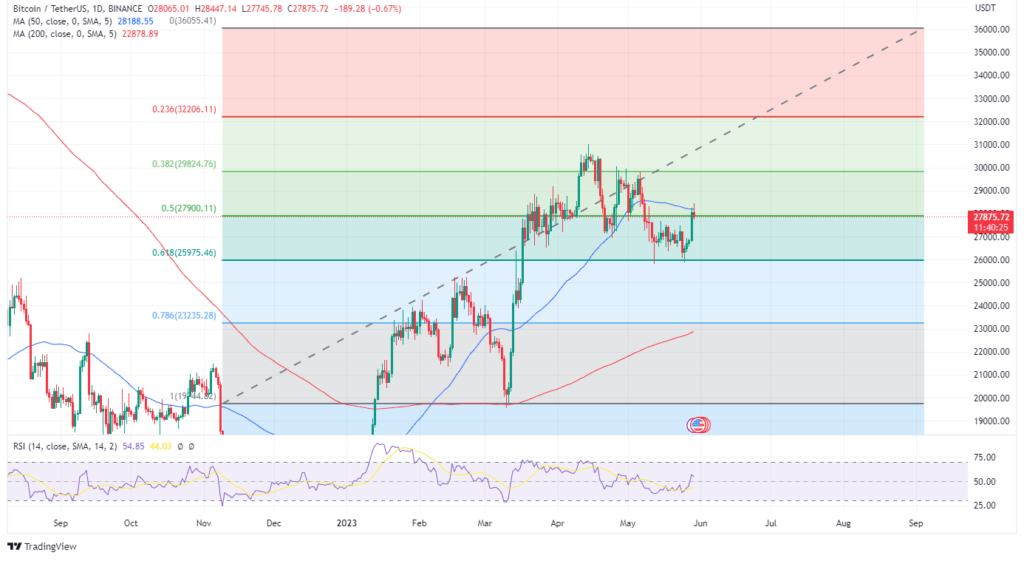
To determine what the likely price targets will be, we need to use a retracement tool, like the Fibonacci Retracement.
Drawing one from Bitcoin’s $19,800 low on 11 March, we get the figure below.

We can see that if Bitcoin breaks through the $28,200 zone (FIB 50%), the likely bullish price targets are:
- $29,824 (FIB 38.2%)
- $32,206 (FIB 23.6%)
- $36,055
For this week, it might be more realistic to have targets from $29,824 to $32,206.
However, keep in mind that if Bitcoin declines from $28,200, it might retest the $26,000 zone. And if this zone fails to hold, Bitcoin will go straight down to $23,200.
Disclaimer: Voice of Crypto aims to deliver accurate and up-to-date information, but it will not be responsible for any missing facts or inaccurate information. Cryptocurrencies are highly volatile financial assets, so research and make your own financial decisions.


