
This Bitcoin extreme fear indicator analysis reveals that the index has plummeted to 14, matching levels last seen during the 2022 bear market when Bitcoin crashed 80% from its peak. With $250 million in ETF outflows, social media dominance hitting a four-month high, and price breaking below $99,000 support, multiple sentiment indicators suggest the market has reached capitulation levels that historically preceded either major bottoms or further decline.
Key Insights
- Bitcoin sentiment has fallen to extreme fear after the recent correction.
- ETF outflows now show that caution is rising among short-term participants.
- Social media activity around Bitcoin has surged during the sell-off as well.
This Bitcoin extreme fear indicator analysis shows sentiment has taken a nosedive as the Crypto Fear and Greed Index dropped to 14, one of its lowest readings this year and matching levels last seen during the 2022 bear market.
Traders now question if the decline has reached exhaustion or if more weakness will follow. Understanding the extreme fear reading is essential for traders, as the move shows growing anxiety across the market and comes during fast price swings that have unsettled participants who remember the last time this indicator reached similar levels.
Bitcoin Extreme Fear Indicator Analysis: Sentiment Tools Signal Panic
The Bitcoin extreme fear indicator analysis relies on the Crypto Fear and Greed Index, which compiles data from several sources, including volatility levels, trading volume, search activity, social media discussions, derivatives positioning, and on-chain indicators.
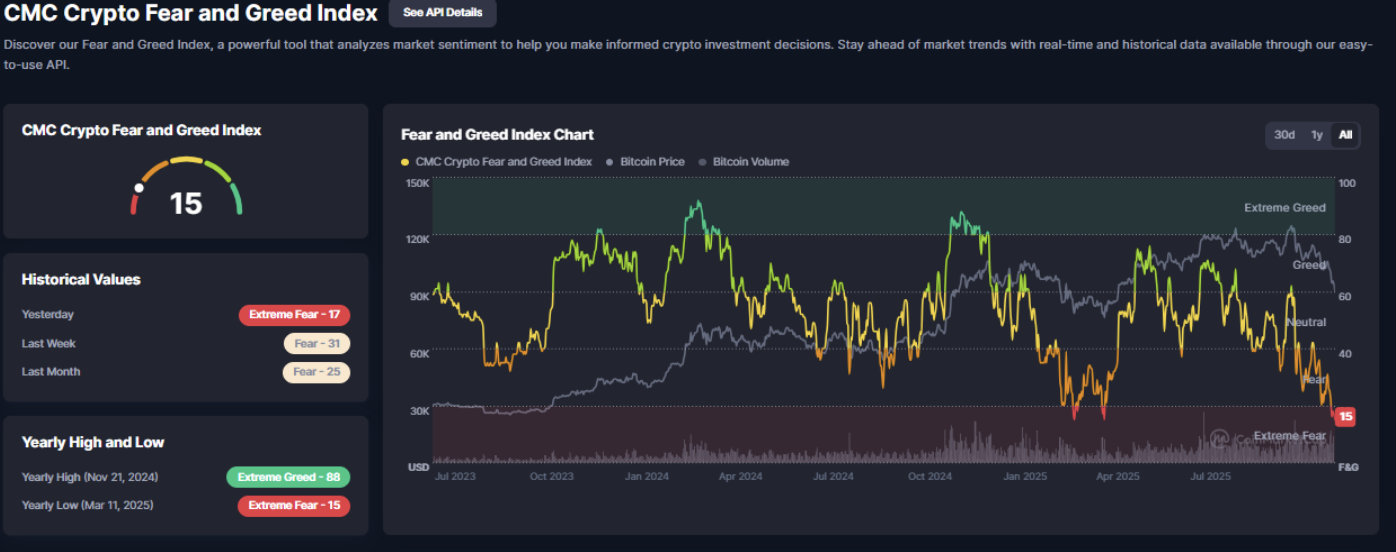
So far, current readings sit near the lowest levels since early in the year, as per Coinmarketcap. This has placed the signal inside a warning zone that often appears during corrections.
The index has shown similar readings at earlier market lows, although not every low has followed the same script.
Bitcoin Extreme Fear Indicator Analysis: Historic Turning Point
The extreme fear reading becomes more compelling when examining several historic data points that show how Bitcoin behaved during sentiment drops, with the index reaching extreme greed near major peaks and dropping below 20 at major lows.
The index reached extreme greed near major peaks in April 2021, November 2021, and March 2024. In contrast, major lows formed when the index dropped below twenty. Examples include July 2021, June 2022, December 2022, August 2024, and March 2025.
These patterns are useful but not perfect. Extreme greed did not always mark the absolute top. Extreme fear did not always mark the exact bottom. Traders who rely only on this indicator often act too quickly, and some sell early during strength.
Others buy early during weakness, and the index helps explain behavior, although it does not predict precise turning points.
This is why many analysts remain surprisingly optimistic even during extreme fear phases, as discussed in our article: Crypto Market Turns Extremely Fearful — but Why Are Analysts Optimistic This Time?
Price Action Indicates More Decline
The Bitcoin extreme fear indicator analysis aligns with price action showing more room to fall, as Bitcoin recently broke below an important weekly support near $99,000, changing the trend structure and confirming a move lower.
The next major support sits near $78,000. This zone has triggered strong rebounds during earlier downtrends and could attract new interest if the price reaches it.
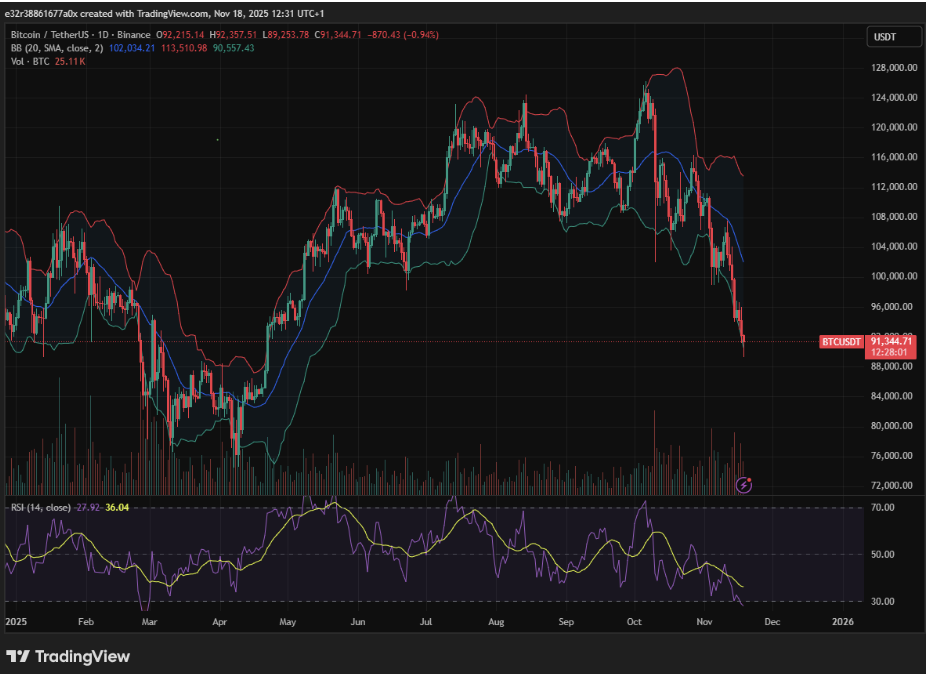
An immediate rebound is possible. Price could retest resistance near $99,000. Current behavior indicates a lower chance of such a move, as sellers still control direction.
So far, buying strength has not shown enough evidence to support a change in trend.
ETF Flows Turn Negative After Months of Inflows
The Bitcoin extreme fear indicator analysis is reinforced by sentiment weakness visible in ETF flows, with Bitcoin ETFs in the United States recording several days of massive withdrawals totaling more than $250 million on Monday alone. Fidelity’s Wise Origin Bitcoin Fund also saw notable exits, while several other products, including the ARK 21Shares Bitcoin ETF and Bitwise Bitcoin ETF, recorded losses as well, as per Farside
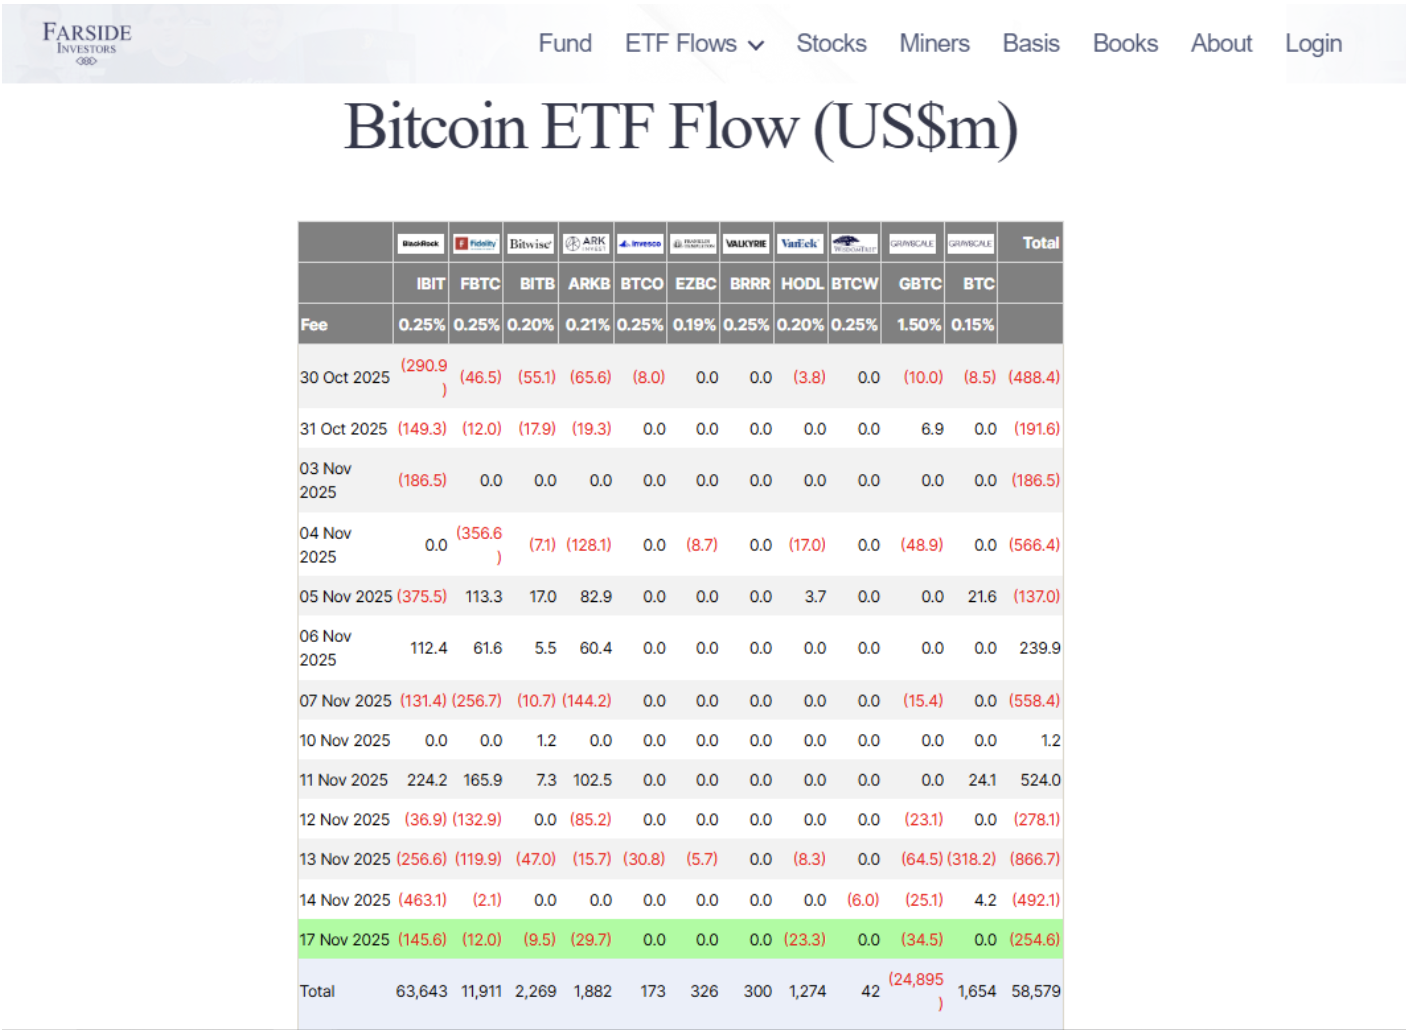
The declines follow an even heavier period of withdrawals earlier in the month. The flow-weighted cost basis for all United States Bitcoin ETFs now sits near $89,600. Bitcoin dipped below this level, which pushed the average participant into losses.
Some early buyers who entered at lower prices are still trading above their cost basis. Most longer-term ETF holders tend to maintain positions despite short-term weakness, according to several analysts.
Ether ETFs also saw major exits. BlackRock’s iShares Ethereum Trust recorded the largest withdrawal among Ether-related products. In all, market conditions remain cautious across both major assets.
One group continues to resist the trend. Solana ETFs recorded another day of positive inflows, and these products have maintained steady interest since launch and have added several hundred million dollars in combined inflows.
Social Media Attention on Bitcoin Reaches a Four-Month High
The Bitcoin extreme fear indicator analysis extends to social data, with analytics firm Santiment reporting a surge in Bitcoin social dominance to more than 36% during the recent sell-off, the highest level since July, when panic selling occurred. The last time the metric reached similar territory was July 13, when it climbed above thirty-seven percent.
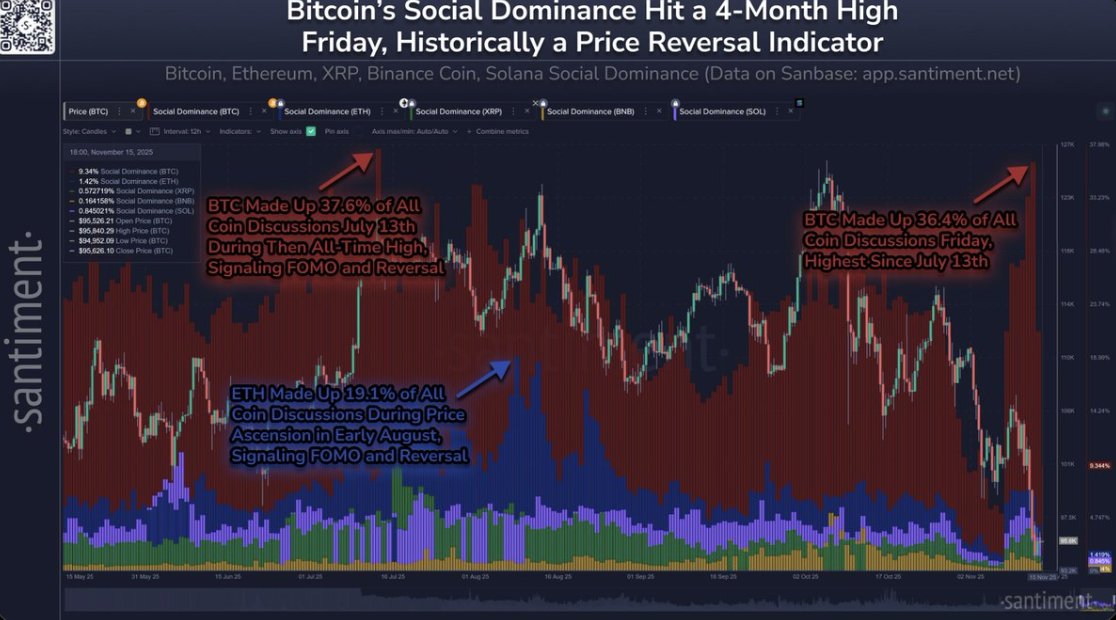
Social dominance spikes often appear during emotional trading periods. A strong rise during price declines usually indicates rising panic, and previous spikes have aligned with market turning points, although not every spike led to a reversal.
A similar pattern surfaced in August when Ethereum discussions jumped and several assets paused their advance shortly afterward.
Summarily, the index has not fallen this low since early in the year, and the last lower reading appeared during the 2022 bear market.
This analysis suggests the market has reached a critical juncture where extreme fear readings of 14, combined with negative ETF flows and elevated social dominance, create conditions that historically either marked capitulation bottoms or preceded further decline toward the $78,000 support zone.
Disclaimer: This article is intended solely for informational purposes and should not be construed as financial advice. Investing in cryptocurrencies involves substantial risk, including the possible loss of your capital. Readers are encouraged to perform their own research and seek guidance from a licensed financial advisor before making any investment decisions. Voice of Crypto does not endorse or promote any specific cryptocurrency, investment product, or trading strategy mentioned in this article.