
Key Insights
- Despite a long and harrowing downtrend, MATIC is showing signs of recovery.
- It shows a surge in active addresses, and dormant coins are returning to circulation.
- MATIC’s price chart shows signs of a breakout from a descending wedge, which might indicate an upward trend.
- The key price level to watch is $0.43, which is crucial for MATIC’s recovery.
- Potential Downward Movement: If $0.43 fails to hold, the cryptocurrency can hit $0.33.
Polygon’s MATIC hasn’t been very bullish lately, with the cryptocurrency’s current price significantly lower than its all-time high.
However, available data shows that a reversal might be brewing, as demonstrated by a sudden spike in on-chain activity.
This change in market dynamics has caught the attention of market analysts and sparked even more speculation about this $MATIC comeback around $4.3.
The Surge in On-Chain Activity
This week, Santiment’s on-chain analytics platform highlighted an interesting increase in on-chain activity for the Polygon network.
The insights provider showed an increased uptick in active addresses and dormant coins returning to circulation.
This surge is also particularly interesting, given the ongoing price and network activity downtrend before late August.
Polygon has been among the many networks declining since crypto’s retrace began back in March. However, a notable spike in on-chain activity may be a sign that a MATIC reversal may be brewing soon. Active addresses and dormant coin spikes are common signals preceding this. pic.twitter.com/RY5NXe10ZW
— Santiment (@santimentfeed) August 28, 2024
The chart shared by Santiment showed a sharp increase in the movement of dormant tokens this week, along with the second-highest number of active addresses on the network throughout 2024.
This spike does much to show that a price reversal could be incoming for $MATIC soon.
Data from PolygonScan also shows that this decline in active addresses started around mid-2024 when the figures slipped by more than 50% from 1.6 million to a meagre 700,000 by the end of August.
The dump in active addresses
However, despite the ongoing signs of a market recovery, MATIC has dropped by around 55% YTD and is bearish on most timeframes.
But what if all that was about to change?
Price Recovery Inbound for Polygon (MATIC)?
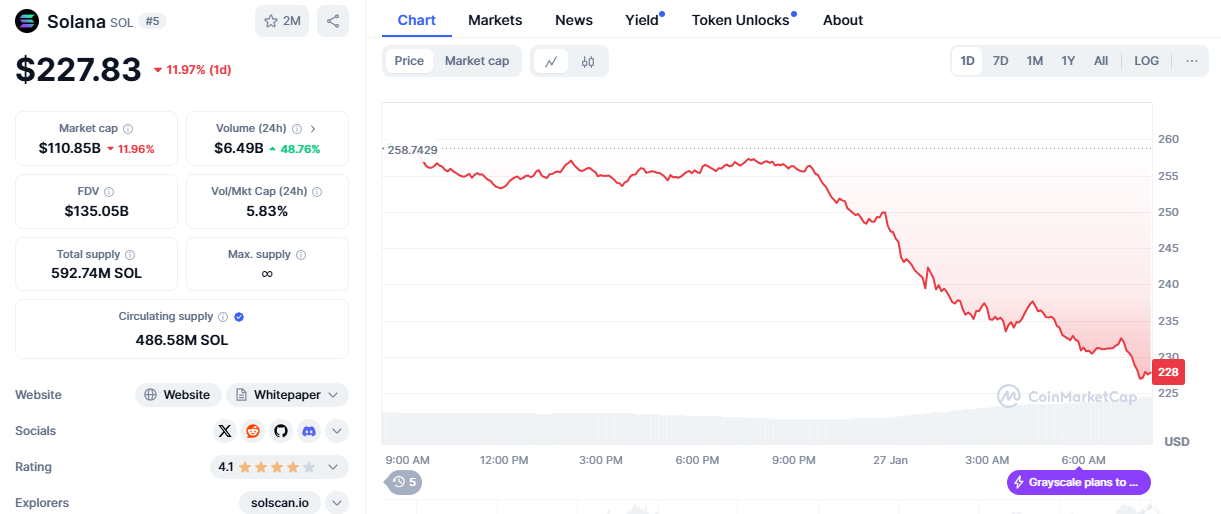
According to data from CoinMarketCap, MATIC isn’t very impressive on the short timeframes either.
The cryptocurrency is down by around 4% on the daily and another 17% on the weekly.
A decline in MATIC
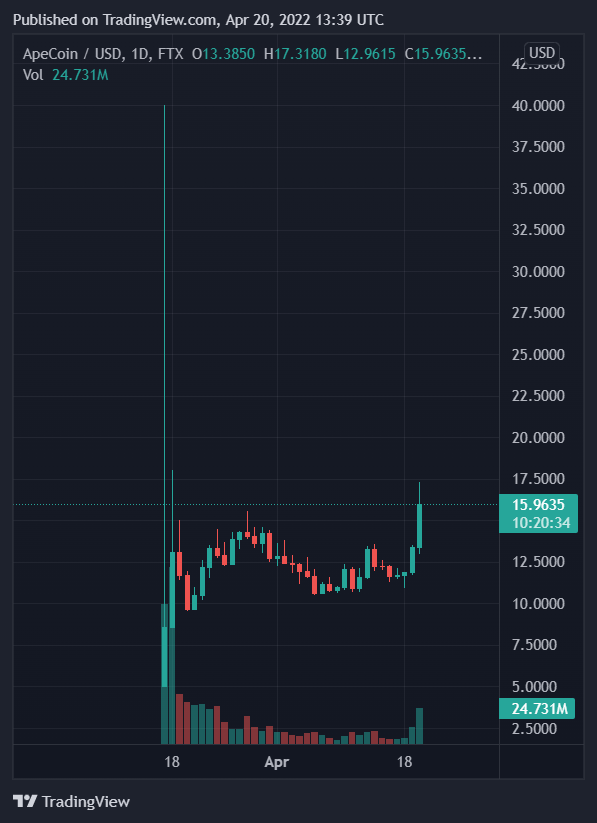
However, according to the charts, the cryptocurrency trades within a descending wedge, characterized by a period of downward consolidation and then a breakout to the upside.
MATIC’s price performance
According to the charts, MATIC broke out successfully from this formation on 19 August.
However, this breakout was short-lived, considering the cryptocurrency’s reversal and retest of the $0.43 zone.
The question now is: Will $0.43 hold?
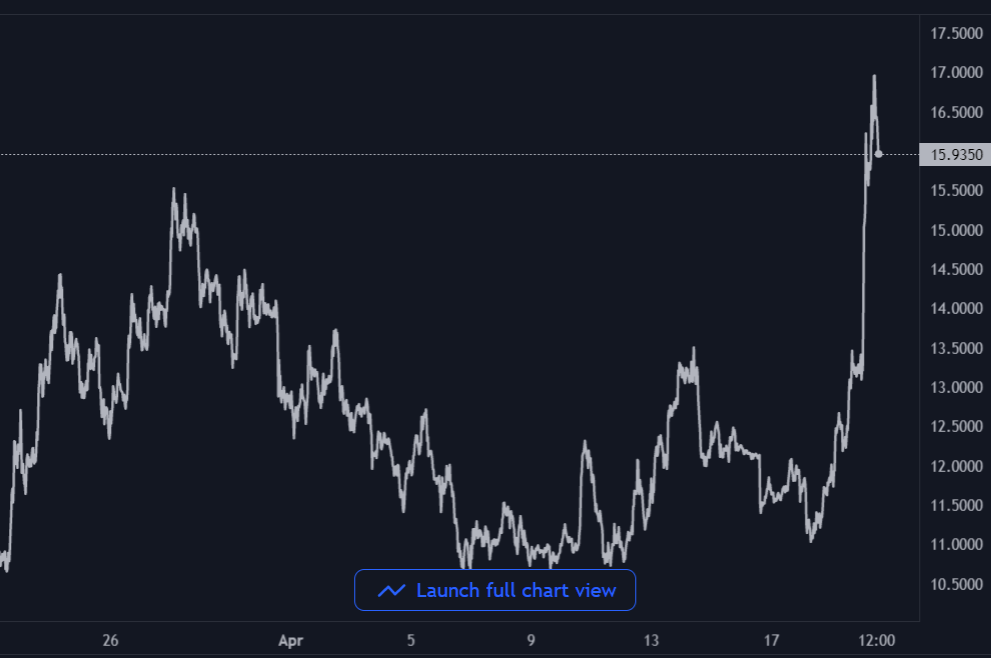
According to the charts, the $0.43 zone held MATIC up within the wedge on 5 July and helped MATIC rebound by a staggering 250% in July 2022, all the way up to the $1.56 zone.
If this price level holds its ground again and we see a rebound, the resistance points to watch include $0.54, $0.7, $0.81, $0.93, and $1 before $1.29.
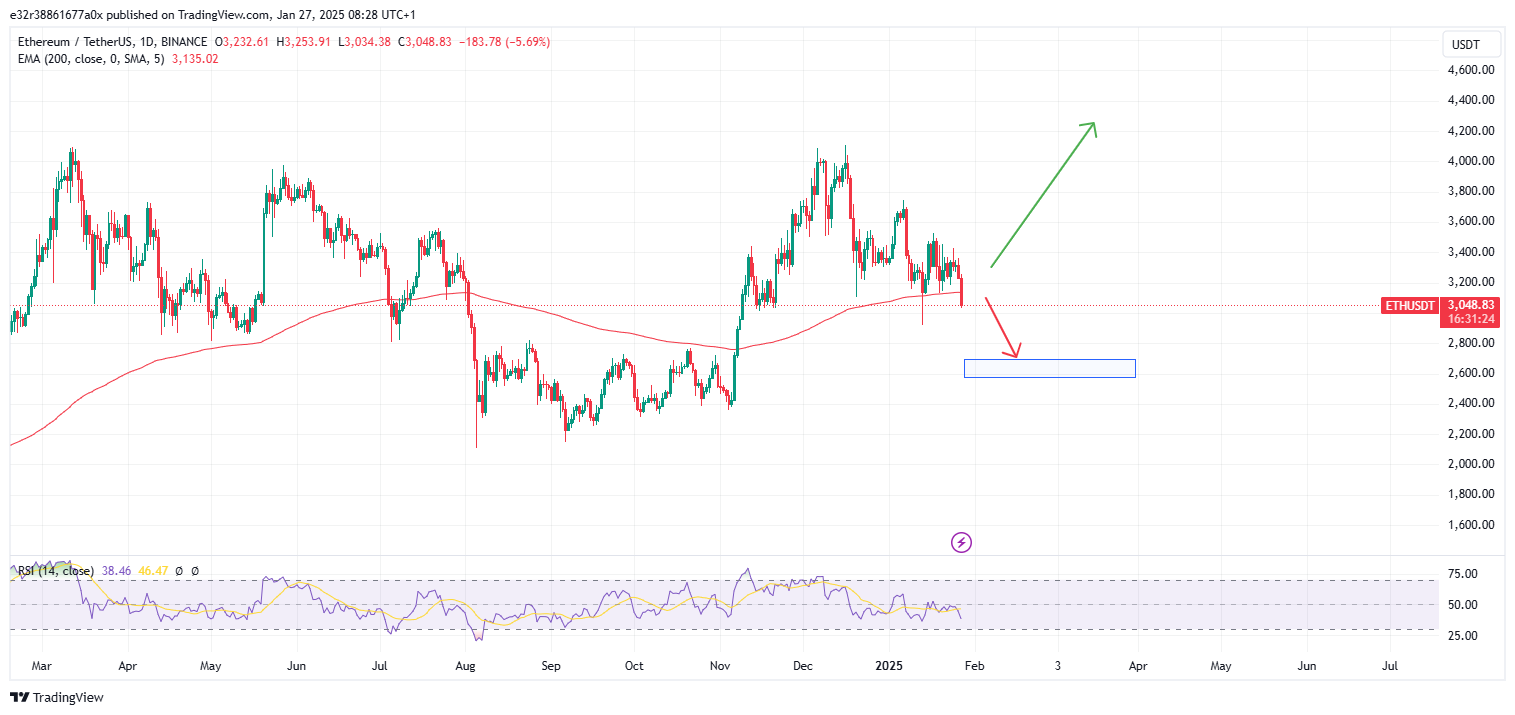
MATIC’s support and resistance
Conversely, if $0.43 fails and MATIC declines, the $0.33 zone is the next most likely source of support for the cryptocurrency.
With this being said:
Support(s): $0.33
Resistances: $0.54, $0.7. $0.81, $0.93 and $1, $1.29.
Disclaimer: This article is intended solely for informational purposes and should not be construed as financial advice. Investing in cryptocurrencies involves substantial risk, including the possible loss of your capital. Readers are encouraged to perform their own research and seek guidance from a licensed financial advisor before making any investment decisions. Voice of Crypto does not endorse or promote any specific cryptocurrency, investment product, or trading strategy mentioned in this article.