Key Insights:
- Bitcoin is in a descending wedge and needs to break through $28,300 to confirm the breakout.
- Ethereum is clearly bullish and has an ascending channel. A rally to $2,100 is possible if it breaks through $1,900.
- XRP is in an ascending channel on the weekly charts and appears to be in a recovery phase.
- Dogecoin has been in a descending channel for the better part of the year and is struggling around $0.0733. It may decline further to $0.057 if it fails to break through this level.
- MATIC is showing some very bearish signs. It is currently under its 200 and 500-day moving averages and is even struggling to break above the 50-day MA.
Over the past week, the cryptocurrency market has seen some ups and downs, with some major coins seeing notable increases and losses.
Through the previous week, Bitcoin (BTC) is up 4.1%, Ethereum (ETH) is up 4.8%, and XRP is up 4.21%. DOGE, on the other hand, is up by a meagre 0.13% and MATIC, the most impressive of all, is up by 7.3%.

We will examine some of the highs and lows of the week for five well-known cryptocurrencies in this article. We will attempt to give you an idea of what is going on in the crypto market, and what you should expect over the next few days/weeks.
Let’s start with…
Bitcoin
After falling below the 50-day moving average sometime on 8th May after the $31,000 rejection, Bitcoin’s price has been in consolidation.
So far, the cryptocurrency has been trading inside a constrained range between $25,800 and $30,000. Because of this, Bitcoin’s next line of action will be based on some equally probable scenarios.
- Will Bitcoin rally upwards and hit the $30,000 zone again, or…
- Will Bitcoin break below $25,800 and hit the 200-day MA around $22,800?

Using Bitcoin’s short to medium-term price action to make our judgement call, we can see that Bitcoin is in a descending wedge.
Descending wedges are bullish formations. And so from this, we can see that Bitcoin will likely break through this formation to the upside.
The question is “When”?
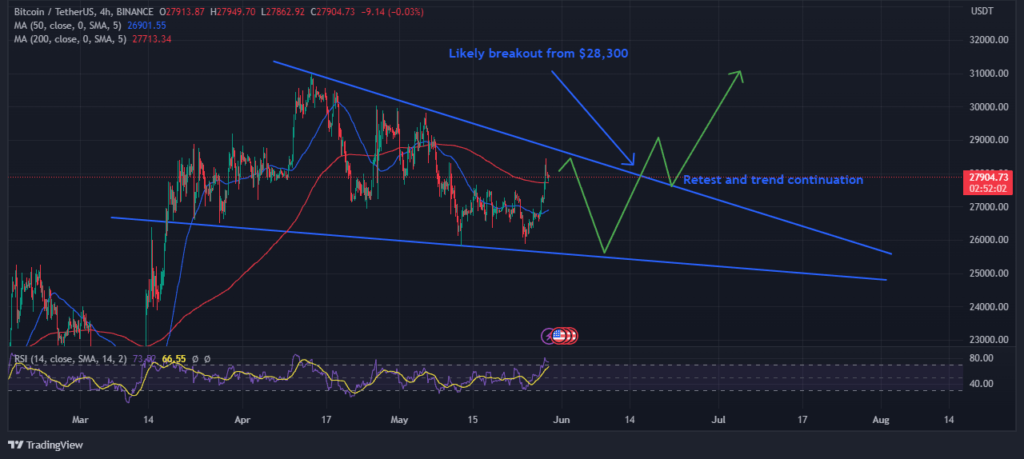
Bitcoin is likely to bounce around inside this formation before a breakout of any kind occurs. But at the end of the day, the fact remains that the cryptocurrency needs to break through the upper resistance of the formation (likely around $28,300).
Bitcoin’s daily RSI is currently above the neutral zone, indicating that the bulls may be in control.
Overall, the $28,300 zone on Bitcoin is an important one to keep an eye out for.
Ethereum
As far as technical analysis goes, Ethereum is clearly bullish.
The cryptocurrency even has an ascending channel on it, formed ever since it hit the $1,070 low in November last year.

Ethereum escaped this formation quite recently in April after it attempted to break through $2,100. However, the bears brought $ETH right back into the channel, and the bulls are stuck trying to break above again.
So far, Ethereum has spent the last few weeks stuck around $1,800. However, the cryptocurrency is rising again and is attempting to break out once more.

The only problem is that the $1,900 zone is a tough one for Ethereum to break.
If the cryptocurrency indeed breaks through $1,900, a rally to $2,100 will become possible. However, if Ethereum fails around this zone, $ETH will plummet straight down to 200-day MA around $1,577.
XRP
For XRP, you should know that John E. Deaton, a well-known XRP lawyer and supporter, recently made a bold prediction about the XRP Price.
Deaton strongly predicts that after XRP breaks through $1, many reluctant investors would rush to the digital asset, pushing its price further upwards to $2.
At the moment, XRP is trading at a mere $0.48 and is not even halfway there yet.
Another anonymous crypto enthusiast by the name “Nick†also made some interesting observations about XRP.
Nick noted in a tweet that XRP’s price would have increased well beyond its present level if it weren’t for the SEC’s case against Ripple.
According to him, a $1 trillion market valuation for XRP (putting XRP at $19), is not impossible, given Ripple’s growth rate and the court case’s proceedings.

On the weekly charts, however, XRP appears to be in an ascending channel.
After a brief rejection from the upper resistance of the channel around $0.44, XRP declined into a retest of its 200-day moving average around $0.41.
The cryptocurrency appears to be in a recovery phase and is poised to retest or break through the channel’s upper resistance again soon.
Dogecoin
The latest happenings on Dogecoin are quite interesting.
As many know, Elon Musk is one of the biggest fans of Dogecoin and has directly influenced its price ever since he began tweeting about it sometime in 2021. However, Dogecoin’s price hit murky waters last week, when in an interview with the Wall Street Journal, Musk warned investors about risking or investing too much in Dogecoin.
As if that wasn’t enough, Musk recently stepped down as CEO of Twitter and appointed Linda Yaccarino as his replacement.
Dogecoin enthusiasts, upon checking Yaccarino’s profile, discovered that she is following the Shiba Inu account: Dogecoin’s biggest rival.
As a result, Dogecoin has only moved up by a measly $0.1% over the last week and has been unimpressive in the charts.

Dogecoin has been in a descending channel for the better part of the year and is currently under both its 200 and 50-day moving averages.
Dogecoin is struggling around $0.0733 and may decline further downwards to $0.057 if it fails to break through this level soon.
Polygon (MATIC)
MATIC’s price action is quite interesting.
While CoinMarketCap data shows that the cryptocurrency is bullish and has risen by +7% over the last week, MATIC is showing some very bearish signs.

As illustrated above, MATIC was trading inside an ascending channel.
However, sometime in late April, the cryptocurrency broke below the lower support of this channel and has been trending lower ever since.
MATIC is currently under its 200 and 500-day moving averages and is even struggling to break above the 50-day MA at the time of writing.
If MATIC manages to clear these moving averages and make a comeback, however, investors may have this opportunity to place some very profitable trades.
On the other hand, if these moving averages continue to hold it down, then further declines are inevitable and MATIC may go as low as $0.74 in the next leg downwards.
Disclaimer: Voice of Crypto aims to deliver accurate and up-to-date information, but it will not be responsible for any missing facts or inaccurate information. Cryptocurrencies are highly volatile financial assets, so research and make your own financial decisions.